

Structural features for α-galactomannan binding to galectin-1
- PMID: 22156919
- PMCID: PMC3287016
- DOI: 10.1093/glycob/cwr173
Structural features for α-galactomannan binding to galectin-1
Abstract
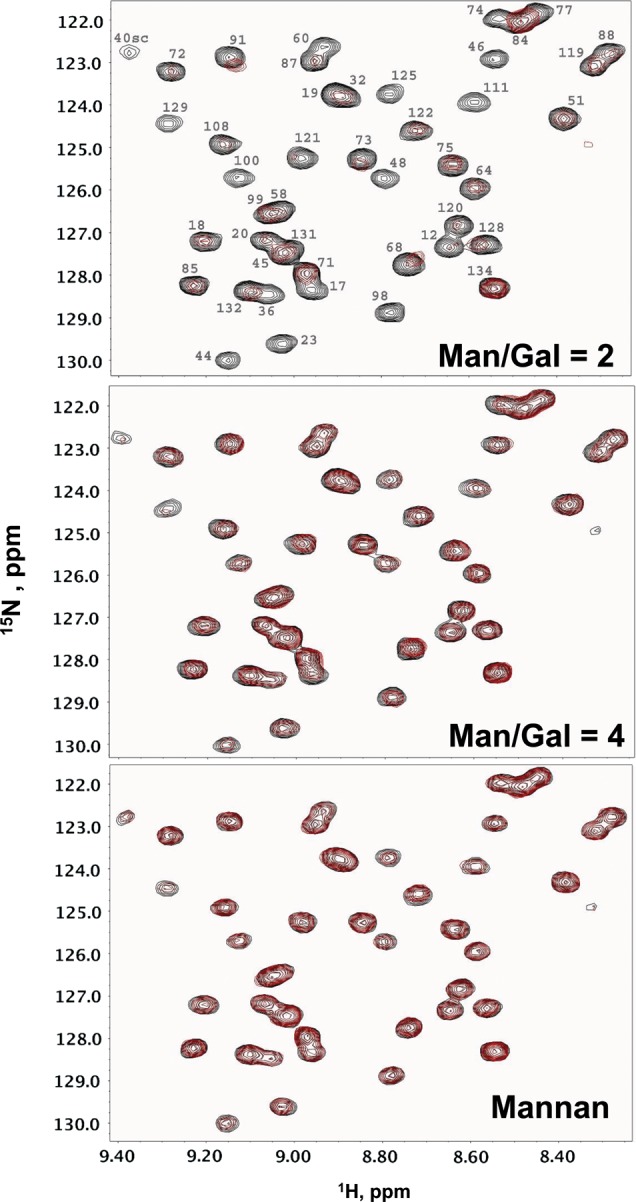
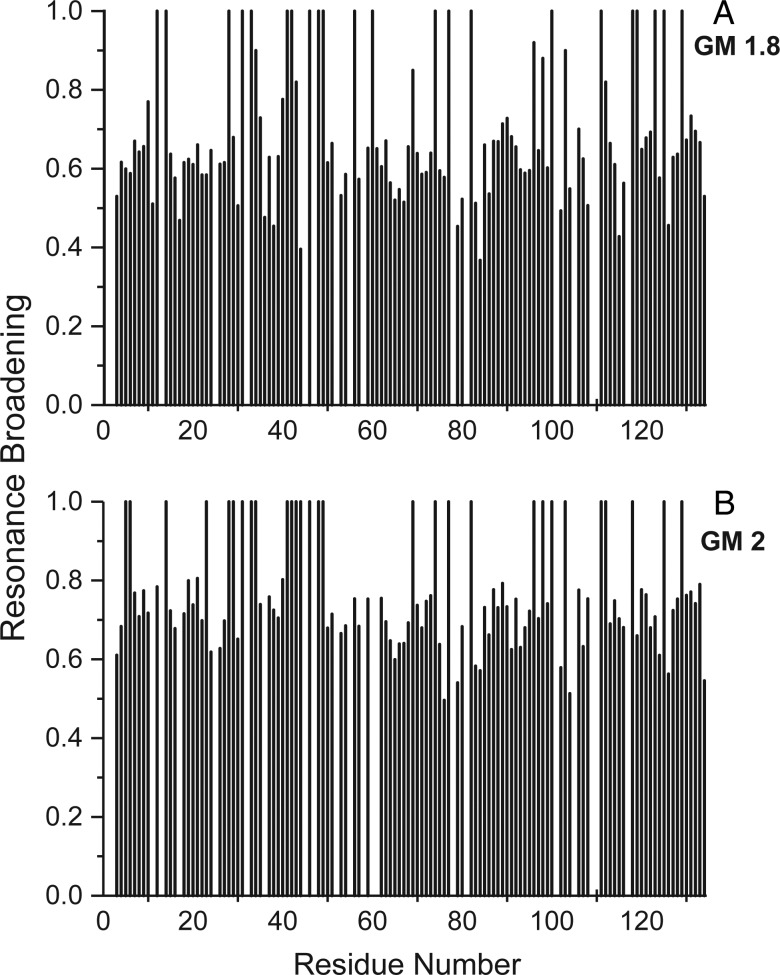
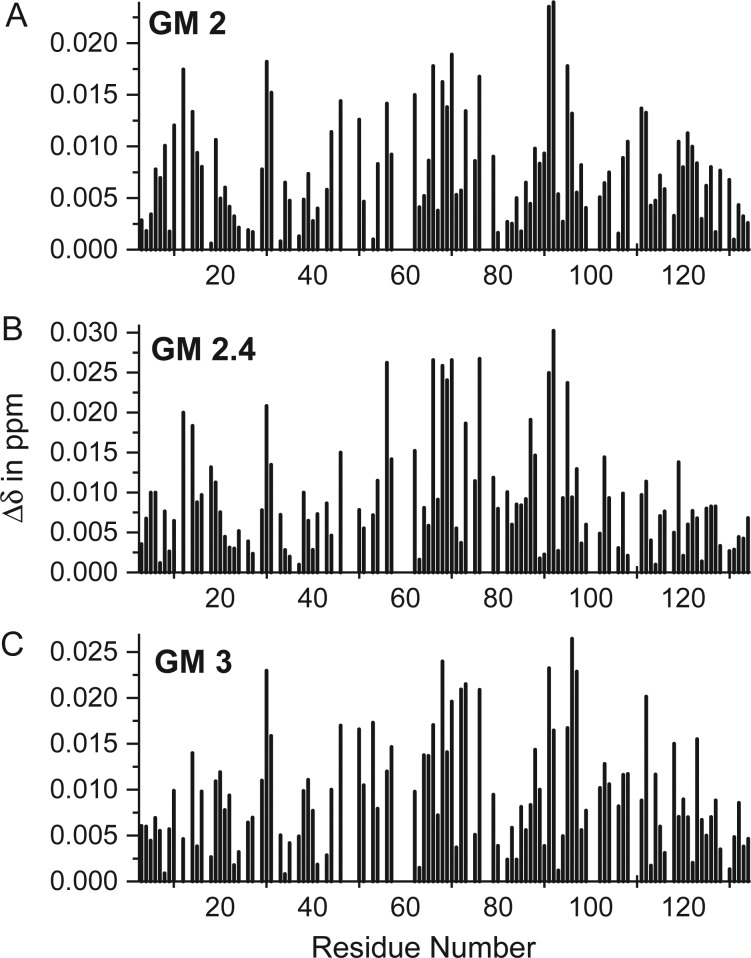
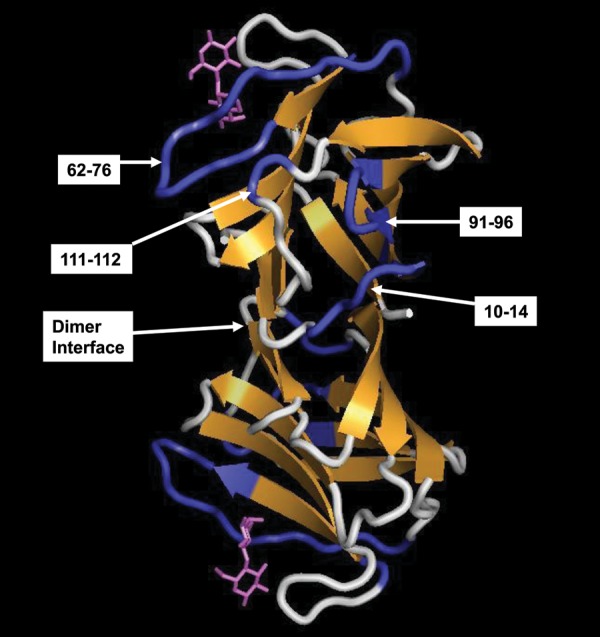
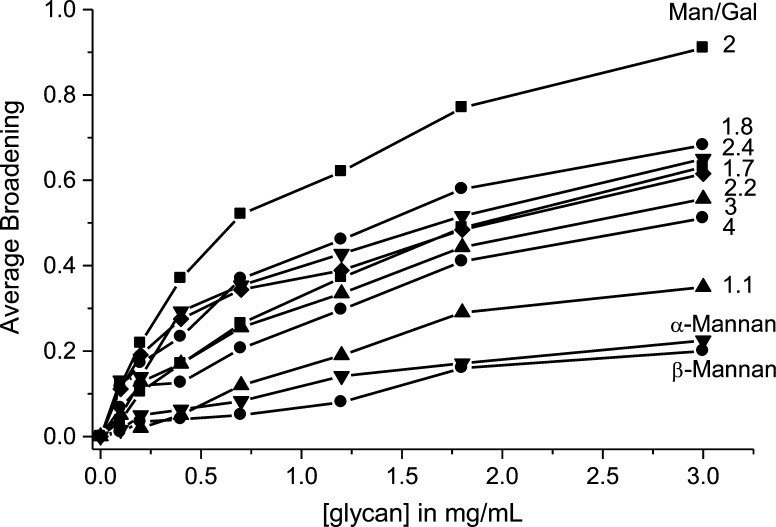
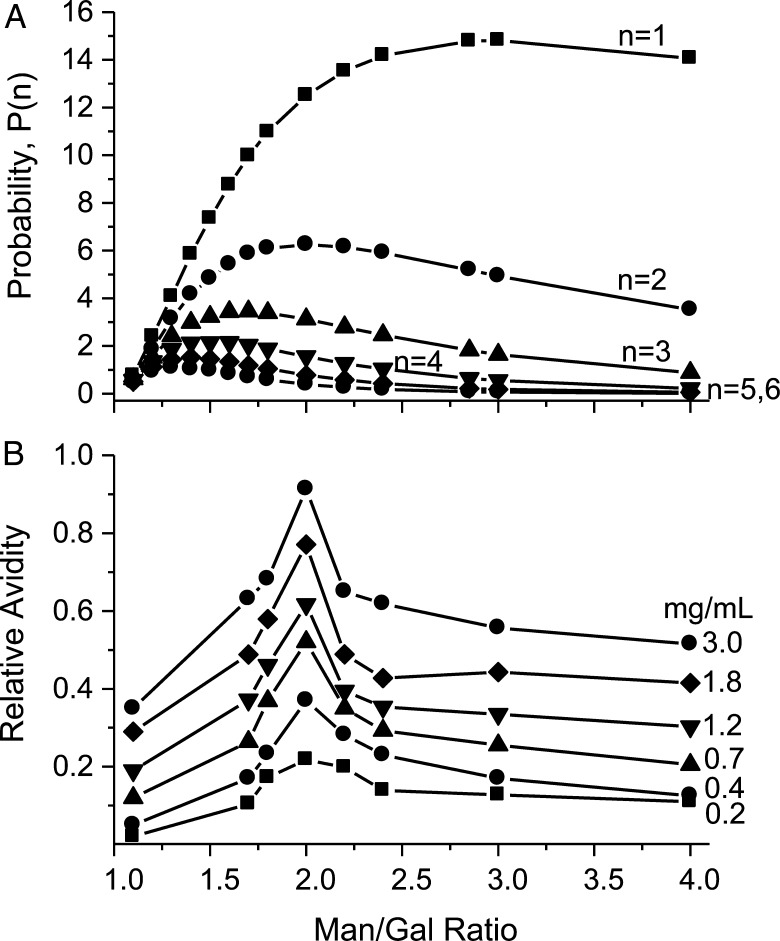
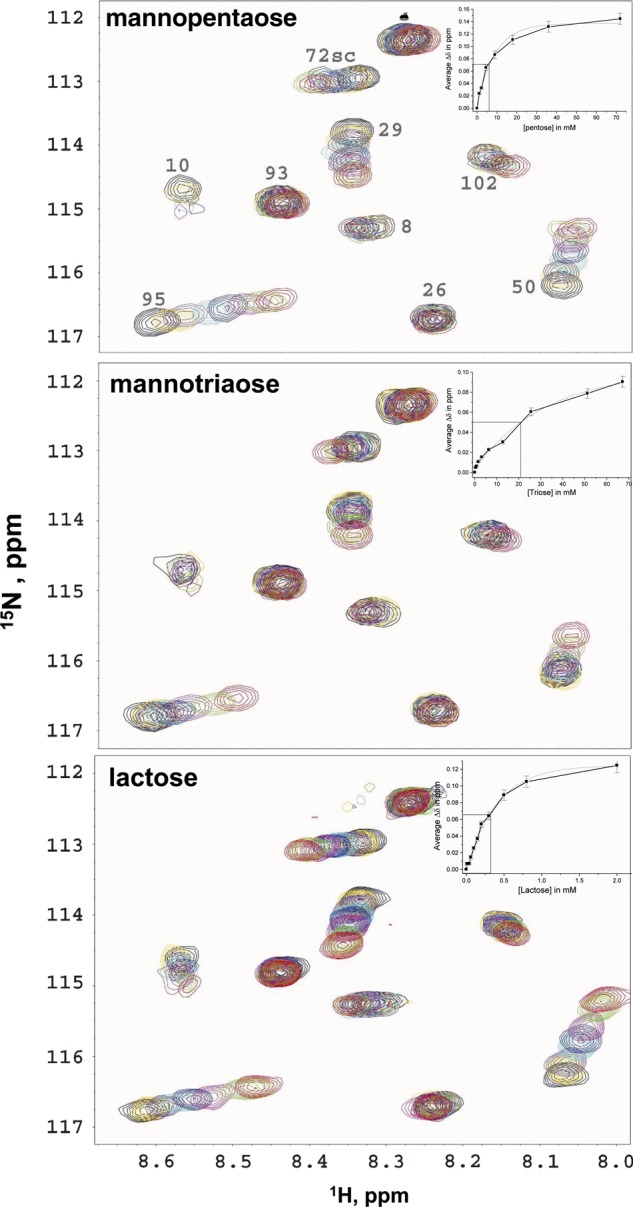
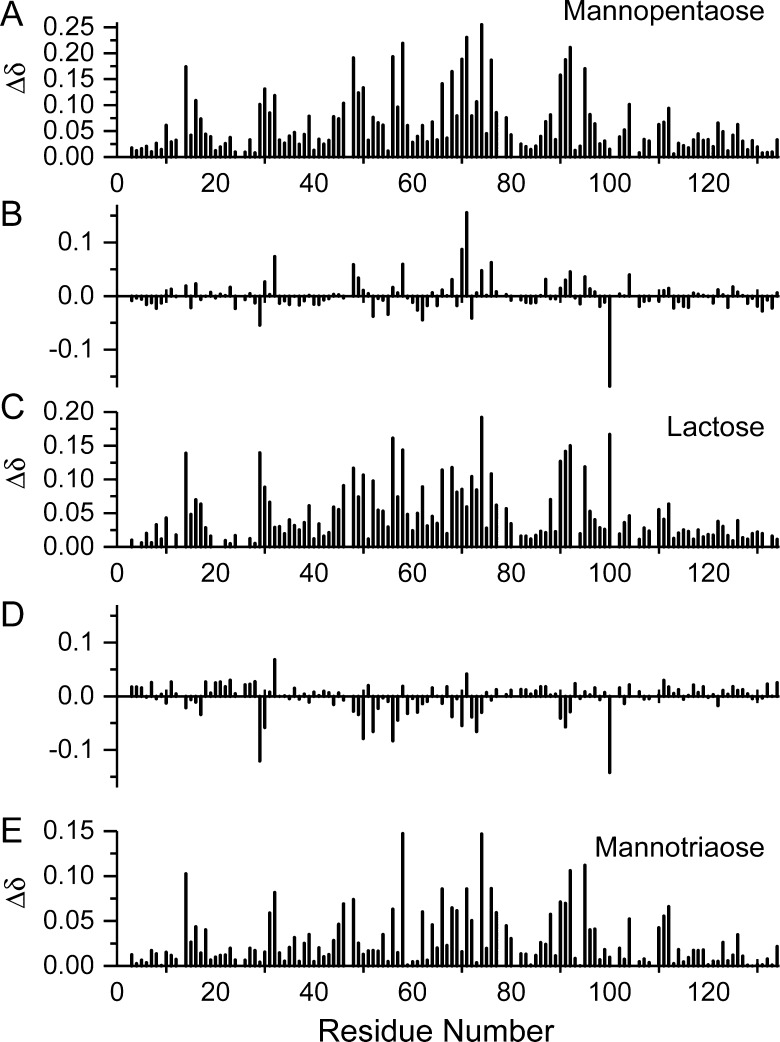
Galectins have a highly conserved carbohydrate-binding domain to which a variety of galactose-containing saccharides, both β- and α-galactosides, can interact with varying degrees of affinity. Recently, we demonstrated that the relatively large α(1 → 6)-D-galacto-β(1 → 4)-D-mannan (Davanat) binds galectin-1 (gal-1) primarily at an alternative carbohydrate-binding domain. Here, we used a series of α-galactomannans (GMs) that vary in their mannose-to-galactose ratios for insight into an optimal structural signature for GM binding to gal-1. Heteronuclear single-quantum coherence nuclear magnetic resonance spectroscopy with (15)N-labeled gal-1 and statistical modeling suggest that the optimal signature consists of α-D-galactopyranosyl doublets surrounded by regions of about four or more "naked" mannose residues. These relatively large and complex GMs all appear to interact with varying degrees at essentially the same binding surface on gal-1 that includes the Davanat alternative binding site and elements of the canonical β-galactoside-binding region. The use of two small, well-defined GMs [6(1)-α(1 → 6)-D-galactosyl-β-D-mannotriaose and 6(3),6(4)-di-α(1 → 6)-D-galactosyl-β-D-mannopentaose] helped characterize how GMs, in general, interact in part with the canonical site. Overall, our findings contribute to better understanding interactions of gal-1 with larger, complex polysaccharides and to the development of GM-based therapeutics for clinical use.
Figures
Similar articles
-
Binding of polysaccharides to human galectin-3 at a noncanonical site in its carbohydrate recognition domain.Glycobiology. 2016 Jan;26(1):88-99. doi: 10.1093/glycob/cwv073. Glycobiology. 2016. PMID: 26646771 Free PMC article.
-
The alpha-galactomannan Davanat binds galectin-1 at a site different from the conventional galectin carbohydrate binding domain.Glycobiology. 2009 Sep;19(9):1034-45. doi: 10.1093/glycob/cwp084. Epub 2009 Jun 18. Glycobiology. 2009. PMID: 19541770 Free PMC article.
-
The carbohydrate-binding domain on galectin-1 is more extensive for a complex glycan than for simple saccharides: implications for galectin-glycan interactions at the cell surface.Biochem J. 2009 Jun 26;421(2):211-21. doi: 10.1042/BJ20090265. Biochem J. 2009. PMID: 19432560 Free PMC article.
-
Biosynthesis of galactomannans found in filamentous fungi belonging to Pezizomycotina.Biosci Biotechnol Biochem. 2018 Feb;82(2):183-191. doi: 10.1080/09168451.2017.1422383. Epub 2018 Jan 15. Biosci Biotechnol Biochem. 2018. PMID: 29334321 Review.
-
Oligosaccharide specificity of galectins: a search by frontal affinity chromatography.Biochim Biophys Acta. 2002 Sep 19;1572(2-3):232-54. doi: 10.1016/s0304-4165(02)00311-2. Biochim Biophys Acta. 2002. PMID: 12223272 Review.
Cited by
-
Binding of polysaccharides to human galectin-3 at a noncanonical site in its carbohydrate recognition domain.Glycobiology. 2016 Jan;26(1):88-99. doi: 10.1093/glycob/cwv073. Glycobiology. 2016. PMID: 26646771 Free PMC article.
-
Targeting galectin-driven regulatory circuits in cancer and fibrosis.Nat Rev Drug Discov. 2023 Apr;22(4):295-316. doi: 10.1038/s41573-023-00636-2. Epub 2023 Feb 9. Nat Rev Drug Discov. 2023. PMID: 36759557 Review.
-
Galectin-1 and Galectin-3 in B-Cell Precursor Acute Lymphoblastic Leukemia.Int J Mol Sci. 2022 Nov 18;23(22):14359. doi: 10.3390/ijms232214359. Int J Mol Sci. 2022. PMID: 36430839 Free PMC article.
-
Glycodendrimers: tools to explore multivalent galectin-1 interactions.Beilstein J Org Chem. 2015 May 12;11:739-47. doi: 10.3762/bjoc.11.84. eCollection 2015. Beilstein J Org Chem. 2015. PMID: 26124876 Free PMC article.
-
Intra- and intermolecular interactions of human galectin-3: assessment by full-assignment-based NMR.Glycobiology. 2016 Aug;26(8):888-903. doi: 10.1093/glycob/cww021. Epub 2016 Feb 23. Glycobiology. 2016. PMID: 26911284 Free PMC article.
References
-
- Barondes SH, Castronovo V, Cooper DN, Cummings RD, Drickamer K, Feizi T, Gitt MA, Hirabayashi J, Hughes C, Kasai K, et al. Galectins: A family of animal β-galactoside-binding lectins. Cell. 1994;76:597–598. doi:10.1016/0092-8674(94)90498-7. - DOI - PubMed
-
- Cao Z, Said N, Amin S, Wu HK, Bruce A, Garate M, Hsu DK, Kuwabara I, Liu FT, Panjwani N. Galectins-3 and -7, but not galectin-1, play a role in re-epithelialization of wounds. J Biol Chem. 2002;277:42299–42305. doi:10.1074/jbc.M200981200. - DOI - PubMed
-
- Daas PJH, Schols HA, de Jongh HHJ. On the galactosyl distribution of commercial galactomannans. Carbohydr Res. 2000;329:609–619. doi:10.1016/S0008-6215(00)00209-3. - DOI - PubMed
-
- Delaglio F, Grzesiek S, Vuister GW, Zhu G, Pfeifer J, Bax A. J Biomol NMR. 1995;6:277–293. - PubMed
-
- Fischer C, Sanchez-Ruderisch H, Welzel M. Galectin-1 interacts with the α5β1 fibronectin receptor to restrict carcinoma cell growth via induction of p21 and p27. J Biol Chem. 2005;280:37266–37277. doi:10.1074/jbc.M411580200. - DOI - PubMed
Publication types
MeSH terms
Substances
Grants and funding
LinkOut - more resources
Full Text Sources
Research Materials
Miscellaneous
