

Engineering hyperthermophilic archaeon Pyrococcus furiosus to overproduce its cytoplasmic [NiFe]-hydrogenase
- PMID: 22157005
- PMCID: PMC3270980
- DOI: 10.1074/jbc.M111.290916
Engineering hyperthermophilic archaeon Pyrococcus furiosus to overproduce its cytoplasmic [NiFe]-hydrogenase
Abstract
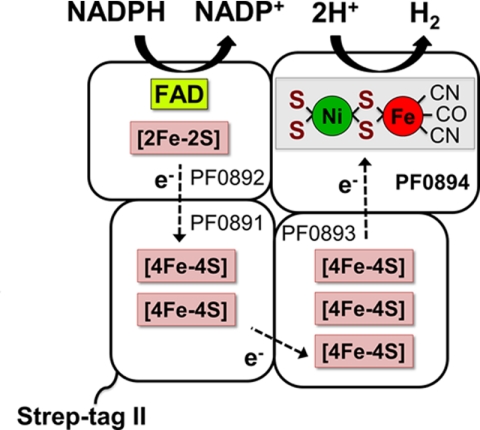
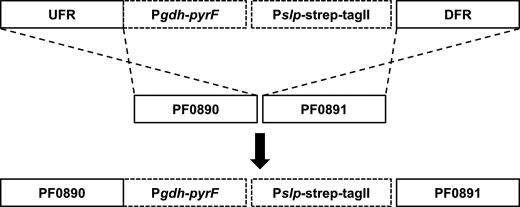
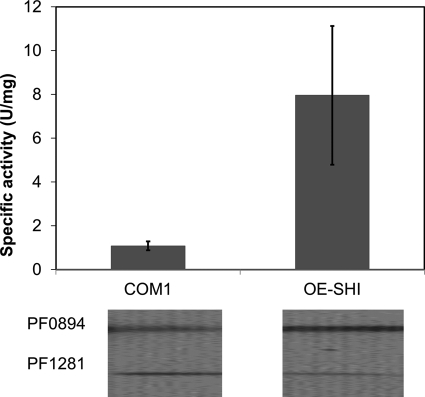
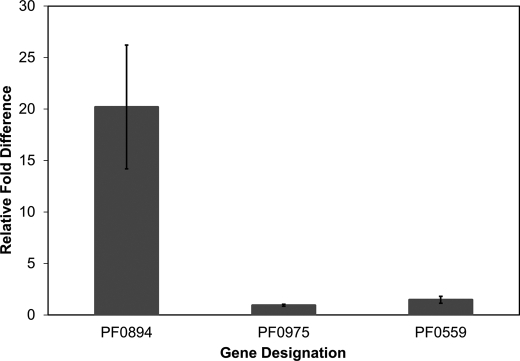
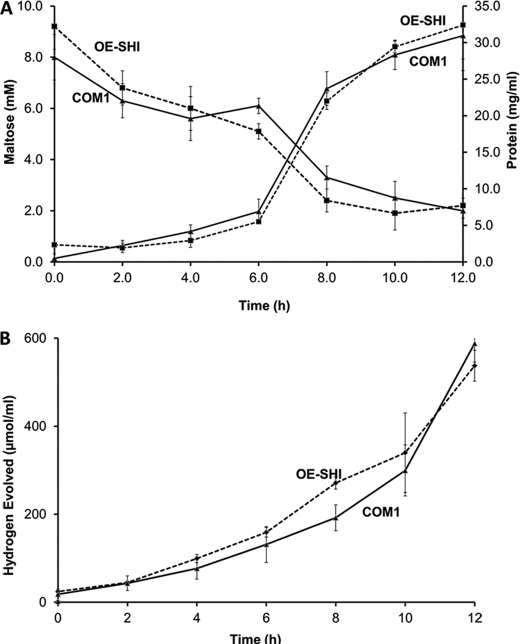
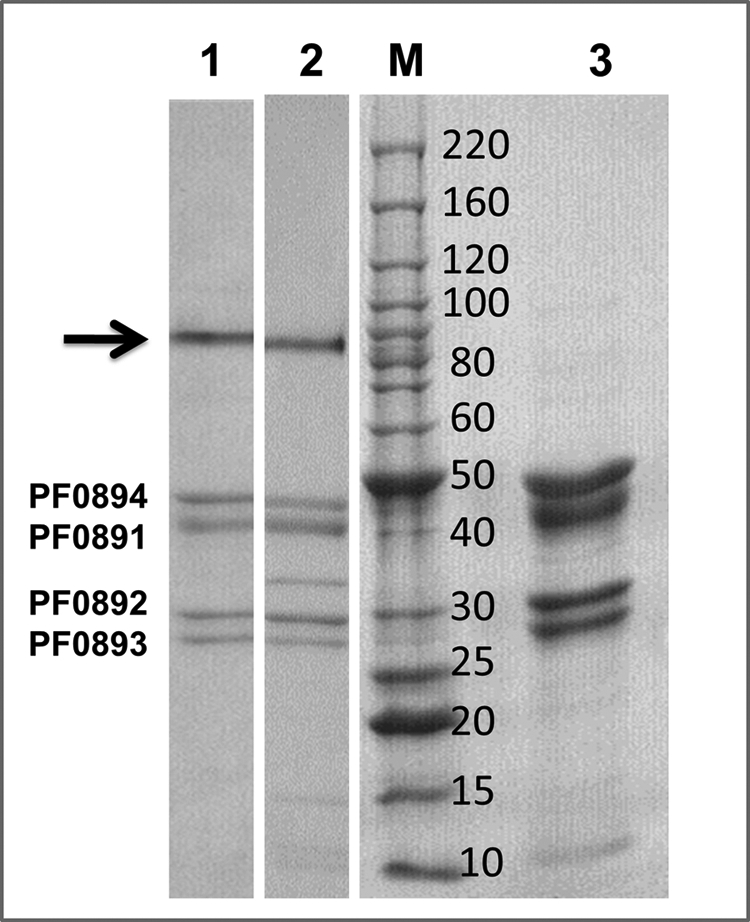
The cytoplasmic hydrogenase (SHI) of the hyperthermophilic archaeon Pyrococcus furiosus is an NADP(H)-dependent heterotetrameric enzyme that contains a nickel-iron catalytic site, flavin, and six iron-sulfur clusters. It has potential utility in a range of bioenergy systems in vitro, but a major obstacle in its use is generating sufficient amounts. We have engineered P. furiosus to overproduce SHI utilizing a recently developed genetic system. In the overexpression (OE-SHI) strain, transcription of the four-gene SHI operon was under the control of a strong constitutive promoter, and a Strep-tag II was added to the N terminus of one subunit. OE-SHI and wild-type P. furiosus strains had similar rates of growth and H(2) production on maltose. Strain OE-SHI had a 20-fold higher transcription of the polycistronic hydrogenase mRNA encoding SHI, and the specific activity of the cytoplasmic hydrogenase was ∼10-fold higher when compared with the wild-type strain, although the expression levels of genes encoding processing and maturation of SHI were the same in both strains. Overexpressed SHI was purified by a single affinity chromatography step using the Strep-tag II, and it and the native form had comparable activities and physical properties. Based on protein yield per gram of cells (wet weight), the OE-SHI strain yields a 100-fold higher amount of hydrogenase when compared with the highest homologous [NiFe]-hydrogenase system previously reported (from Synechocystis). This new P. furiosus system will allow further engineering of SHI and provide hydrogenase for efficient in vitro biohydrogen production.
Figures
References
-
- Vignais P. M., Billoud B. (2007) Occurrence, classification, and biological function of hydrogenases: an overview. Chem. Rev. 107, 4206–4272 - PubMed
-
- Vignais P. M., Colbeau A. (2004) Molecular biology of microbial hydrogenases. Curr. Issues Mol. Biol. 6, 159–188 - PubMed
-
- Jenney F. E., Jr., Adams M. W. (2008) Hydrogenases of the model hyperthermophiles. Ann. N.Y. Acad. Sci. 1125, 252–266 - PubMed
-
- Fontecilla-Camps J. C., Volbeda A., Cavazza C., Nicolet Y. (2007) Structure/function relationships of [NiFe]- and [FeFe]-hydrogenases. Chem. Rev. 107, 4273–4303 - PubMed
-
- Pandelia M. E., Ogata H., Lubitz W. (2010) Intermediates in the catalytic cycle of [NiFe]-hydrogenase: functional spectroscopy of the active site. Chemphyschem. 11, 1127–1140 - PubMed
Publication types
MeSH terms
Substances
LinkOut - more resources
Full Text Sources
Other Literature Sources
