

Relationships between spike-free local field potentials and spike timing in human temporal cortex
- PMID: 22157112
- PMCID: PMC3331669
- DOI: 10.1152/jn.00663.2011
Relationships between spike-free local field potentials and spike timing in human temporal cortex
Abstract
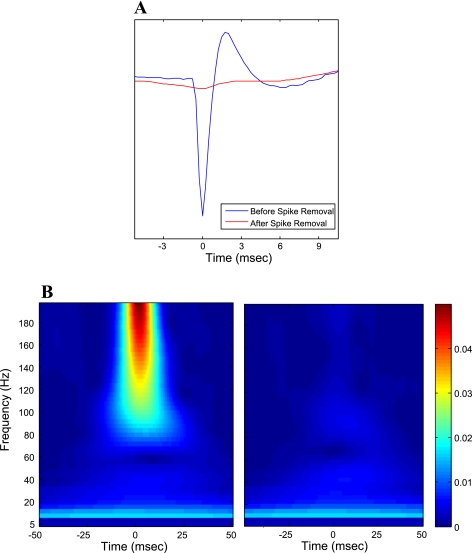
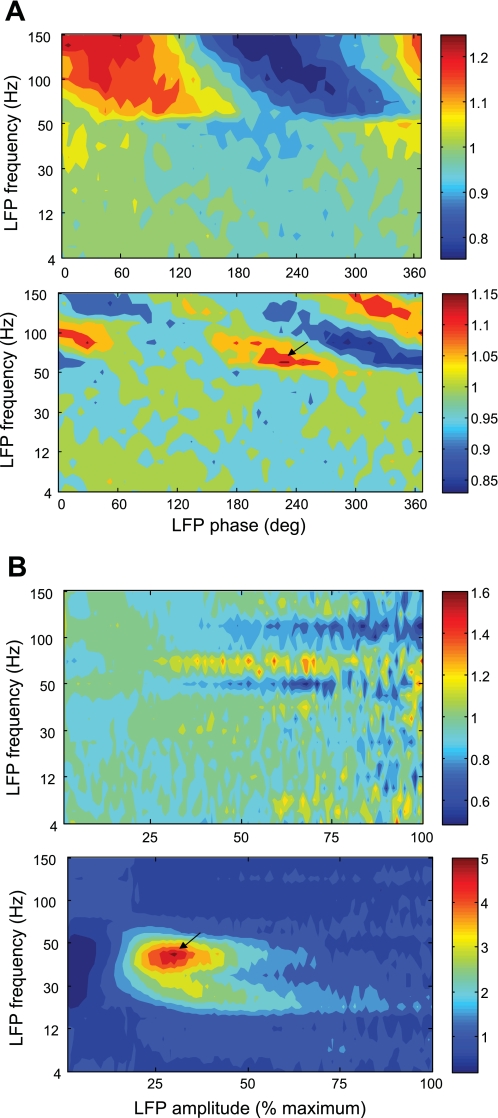
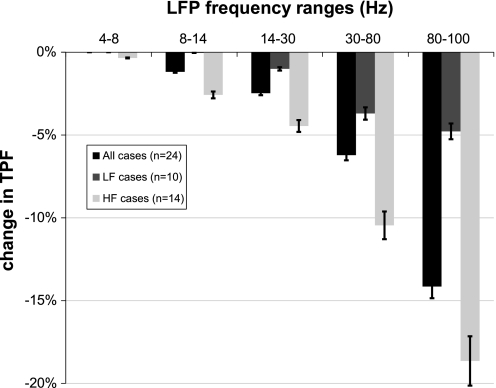
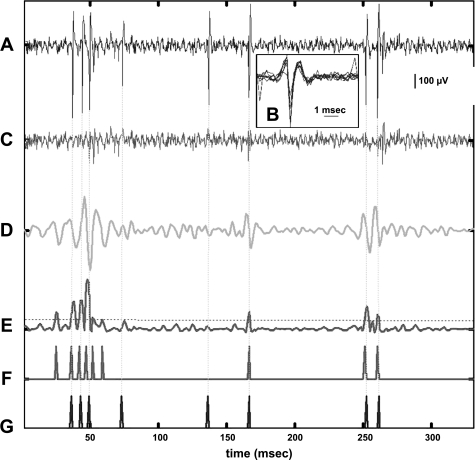
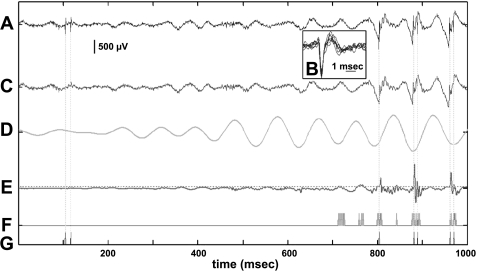
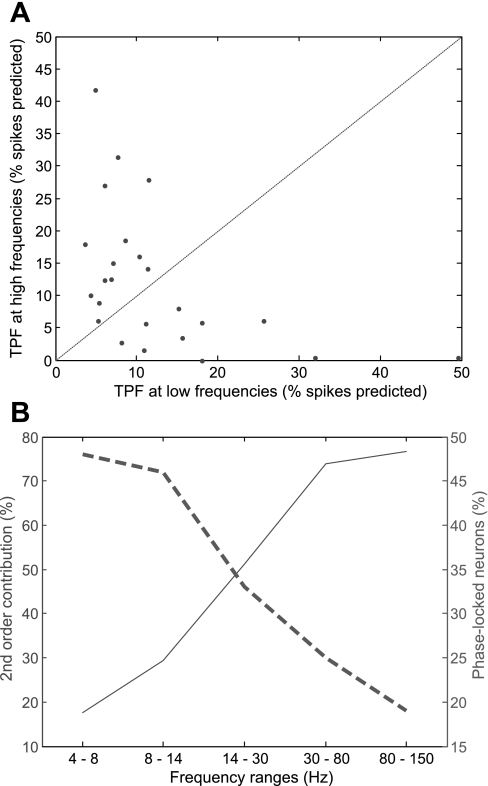
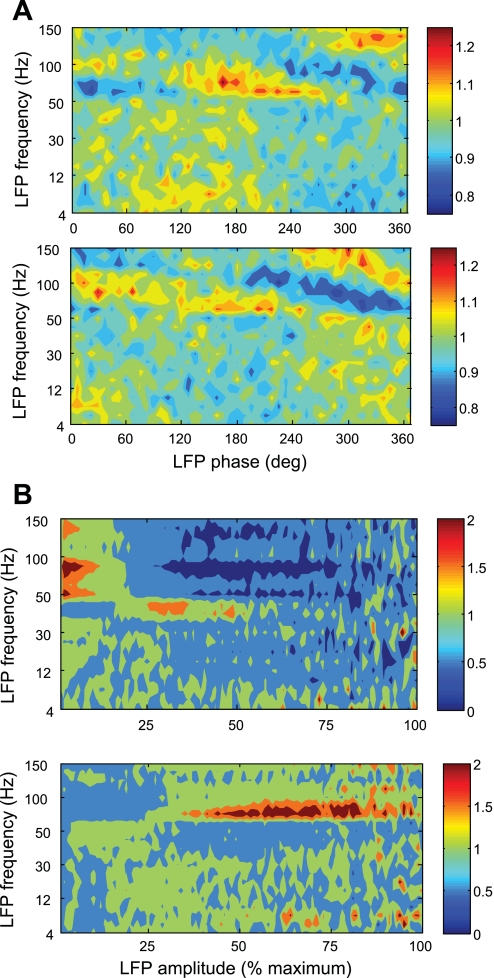
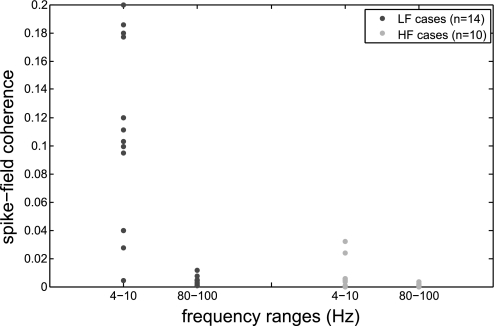
Intracortical recordings comprise both fast events, action potentials (APs), and slower events, known as local field potentials (LFPs). Although it is believed that LFPs mostly reflect local synaptic activity, it is unclear which of their signal components are most closely related to synaptic potentials and would therefore be causally related to the occurrence of individual APs. This issue is complicated by the significant contribution from AP waveforms, especially at higher LFP frequencies. In recordings of single-cell activity and LFPs from the human temporal cortex, we computed quantitative, nonlinear, causal dynamic models for the prediction of AP timing from LFPs, at millisecond resolution, before and after removing AP contributions to the LFP. In many cases, the timing of a significant number of single APs could be predicted from spike-free LFPs at different frequencies. Not surprisingly, model performance was superior when spikes were not removed. Cells whose activity was predicted by the spike-free LFP models generally fell into one of two groups: in the first group, neuronal spike activity was associated with specific phases of low LFP frequencies, lower spike activity at high LFP frequencies, and a stronger linear component in the spike-LFP model; in the second group, neuronal spike activity was associated with larger amplitude of high LFP frequencies, less frequent phase locking, and a stronger nonlinear model component. Spike timing in the first group was better predicted by the sign and level of the LFP preceding the spike, whereas spike timing in the second group was better predicted by LFP power during a certain time window before the spike.
Figures
Similar articles
-
Predicting spike occurrence and neuronal responsiveness from LFPs in primary somatosensory cortex.PLoS One. 2012;7(5):e35850. doi: 10.1371/journal.pone.0035850. Epub 2012 May 7. PLoS One. 2012. PMID: 22586452 Free PMC article.
-
A simple stimulatory device for evoking point-like tactile stimuli: a searchlight for LFP to spike transitions.J Vis Exp. 2014 Mar 25;(85):50941. doi: 10.3791/50941. J Vis Exp. 2014. PMID: 24686295 Free PMC article.
-
Removal of spurious correlations between spikes and local field potentials.J Neurophysiol. 2011 Jan;105(1):474-86. doi: 10.1152/jn.00642.2010. Epub 2010 Nov 10. J Neurophysiol. 2011. PMID: 21068271
-
Modelling and analysis of local field potentials for studying the function of cortical circuits.Nat Rev Neurosci. 2013 Nov;14(11):770-85. doi: 10.1038/nrn3599. Nat Rev Neurosci. 2013. PMID: 24135696 Review.
-
Challenges in the quantification and interpretation of spike-LFP relationships.Curr Opin Neurobiol. 2015 Apr;31:111-8. doi: 10.1016/j.conb.2014.09.004. Epub 2014 Oct 3. Curr Opin Neurobiol. 2015. PMID: 25282542 Review.
Cited by
-
Frequency modulation of cortical rhythmicity governs behavioral variability, excitability and synchrony of neurons in the visual cortex.Sci Rep. 2022 Dec 3;12(1):20914. doi: 10.1038/s41598-022-25264-5. Sci Rep. 2022. PMID: 36463385 Free PMC article.
-
Cellular Classes in the Human Brain Revealed In Vivo by Heartbeat-Related Modulation of the Extracellular Action Potential Waveform.Cell Rep. 2020 Mar 10;30(10):3536-3551.e6. doi: 10.1016/j.celrep.2020.02.027. Cell Rep. 2020. PMID: 32160555 Free PMC article.
-
Superior colliculus peri-saccadic field potentials are dominated by a visual sensory preference for the upper visual field.iScience. 2025 Feb 13;28(3):112021. doi: 10.1016/j.isci.2025.112021. eCollection 2025 Mar 21. iScience. 2025. PMID: 40104053 Free PMC article.
-
Temporal coupling of field potentials and action potentials in the neocortex.Eur J Neurosci. 2018 Oct;48(7):2482-2497. doi: 10.1111/ejn.13807. Epub 2018 Jan 24. Eur J Neurosci. 2018. PMID: 29250852 Free PMC article.
-
Recording and Decoding of Vagal Neural Signals Related to Changes in Physiological Parameters and Biomarkers of Disease.Cold Spring Harb Perspect Med. 2019 Dec 2;9(12):a034157. doi: 10.1101/cshperspect.a034157. Cold Spring Harb Perspect Med. 2019. PMID: 30670469 Free PMC article. Review.
References
-
- Akaike H. Likelihood and the Bayes procedure. In: Bayesian Statistics, edited by Bernardo JM. Valencia, Spain: Valencia University Press, 1980, p. 143–166
-
- Andersen RA, Musallam S, Pesaran B. Selecting the signals for a brain-machine interface. Curr Opin Neurobiol 14: 720–726, 2004 - PubMed
-
- Baker SN, Pinches EM, Lemon RN. Synchronization in monkey motor cortex during a precision grip task. II. Effect of oscillatory activity on corticospinal output. J Neurophysiol 89: 1941–1953, 2003 - PubMed
-
- Buzsaki G, Buhl DL, Harris KD, Csicsvari J, Czeh B, Morozov A. Hippocampal network patterns of activity in the mouse. Neuroscience 116: 201–211, 2003 - PubMed
Publication types
MeSH terms
Grants and funding
LinkOut - more resources
Full Text Sources
Miscellaneous