Comparative Study
. 2012 Mar;107(5):1337-55.
doi: 10.1152/jn.00781.2011. Epub 2011 Dec 7.

Decoding 3D reach and grasp from hybrid signals in motor and premotor cortices: spikes, multiunit activity, and local field potentials

Affiliations
Comparative Study

Decoding 3D reach and grasp from hybrid signals in motor and premotor cortices: spikes, multiunit activity, and local field potentials

Arjun K Bansal et al. J Neurophysiol. 2012 Mar.

Abstract

Neural activity in motor cortex during reach and grasp movements shows modulations in a broad range of signals from single-neuron spiking activity (SA) to various frequency bands in broadband local field potentials (LFPs). In particular, spatiotemporal patterns in multiband LFPs are thought to reflect dendritic integration of local and interareal synaptic inputs, attentional and preparatory processes, and multiunit activity (MUA) related to movement representation in the local motor area. Nevertheless, the relationship between multiband LFPs and SA, and their relationship to movement parameters and their relative value as brain-computer interface (BCI) control signals, remain poorly understood. Also, although this broad range of signals may provide complementary information channels in primary (MI) and ventral premotor (PMv) areas, areal differences in information have not been systematically examined. Here, for the first time, the amount of information in SA and multiband LFPs was compared for MI and PMv by recording from dual 96-multielectrode arrays while monkeys made naturalistic reach and grasp actions. Information was assessed as decoding accuracy for 3D arm end point and grip aperture kinematics based on SA or LFPs in MI and PMv, or combinations of signal types across areas. In contrast with previous studies with ≤16 simultaneous electrodes, here ensembles of >16 units (on average) carried more information than multiband, multichannel LFPs. Furthermore, reach and grasp information added by various LFP frequency bands was not independent from that in SA ensembles but rather typically less than and primarily contained within the latter. Notably, MI and PMv did not show a particular bias toward reach or grasp for this task or for a broad range of signal types. For BCIs, our results indicate that neuronal ensemble spiking is the preferred signal for decoding, while LFPs and combined signals from PMv and MI can add robustness to BCI control.


Figures

Fig. 1.
Fig. 1.
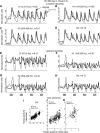
Examples of the 4 different neural signals used for decoding in this study: low-frequency local field potentials (LFPs) (LF, 0.3–2 Hz), high-frequency local field potentials (H1 band, 100–200 Hz; H2 band, 200–400 Hz), and spiking activity (SA) during the same time period from monkey C, session 2, primary motor cortex (MI). For each of the LFP signals, the channel that gave the single best performance was selected and plotted. For the H1 and H2 signal the filtered signal is shown in gray, and the signal squared and averaged in 150-ms windows (as used for decoding) is shown in black (see methods). For the spiking signals, the rasters for the top 10 performing units are plotted (gray vertical lines) along with the averaged spike counts across those 10 units (solid black line). Bottom: measured value of 1 of the 8 kinematic parameters (z-position) that were decoded in this study, during the corresponding time period.
Fig. 2.
Fig. 2.
Examples of decoding kinematic parameters using each of the 4 neural signal types separately from multiple electrodes in MI. Decoding of z-position (A–D) or aperture (E–K), in monkey C, session 2, using the best combinations of inputs (as ascertained with the greedy algorithm, see methods) for each of the 4 neural signals from MI, for the same time segment shown in Fig. 1. A and E: LF (0.3–2 Hz). B and F: H1 band (100–200 Hz). C and G: H2 band (200–400 Hz). D and H: spiking activity (SA). Original kinematics in black, decoded in gray. r values were computed on the entire reconstruction for each parameter and not just for the time segment displayed here. I: normalized aperture amplitude at grasp completion (i.e., at the time the object is actually grasped; 1 sample per trial) tended to cluster in 2 groups corresponding to objects that required either a decrease or an increase in aperture relative to the mean aperture during the session. Decoders captured variations in this aperture amplitude across the 2 clusters, as shown for the example of SA-based decoder in I. J and K: in some cases, it was also possible to capture trial-by-trial variations in aperture amplitude within the same cluster. The slope for the best-fit line and corresponding coefficient of determination R2 for the fit are shown (P < 10−3).
Fig. 3.
Fig. 3.
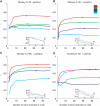
Examples of greedy-selection-based decoding. This figure illustrates the impact of increasing the numbers used of each neural signal type's inputs on kinematic decoding performance. Results of greedy-selection decoding for each of the 4 different signals and for decoding aperture in monkey C, MI (A), x-position in monkey G, MI (B) or ventral premotor cortex (PMv) (C), and z-velocity in monkey G, MI (D) (from session 1 for each monkey) are shown. Four signals were compared: LF, H1, H2, and spiking units. Inverted triangular markers indicate the optimal subset of inputs and the corresponding maximal r for each signal. Insets plot the correlation coefficient (r) when decoding from each of the top 48 (corresponding to those selected by the greedy algorithm) individual units or channels separately in rank order determined by single-channel performance. The medians of the single unit or LF channel performances are indicated with corresponding left-pointing triangles. Note that r for some of the LFP channels or SA units, when used 1 channel or 1 unit at a time respectively, could sometimes be negative. Individual LFP channels or units that did not contain significant kinematic information sometimes gave negative r values on cross-validated data. However, when decoding using multiple input channels or units, at the final step of the greedy algorithm we selected the best subset of LFP channels or SA units, thereby eliminating the deleterious effect of these individual negative r inputs.
Fig. 4.
Fig. 4.
Summary of optimal kinematic decoding performance with each neural signal. Optimal subsets of input channels corresponding to those yielding the maximum correlation coefficient between original and reconstructed kinematics were selected for each signal with a greedy-selection procedure (see methods). Results are the individual kinematic parameter decoding data maximum correlation coefficients (r) (A, B) or the corresponding least normalized root mean squared errors (nRMSEs) (C, D) for the entire data set [8 kinematic parameters decoded with data from 2 sessions in each of 2 monkeys (monkey C, light green; monkey G, magenta) in MI (A, C), and PMv (B, D)]. In A–D, bars indicate the mean of the max r or mean nRMSE between original and decoded kinematics (color convention similar to Fig. 3) and dot markers represent individual session results. Vertical line at r = 0.2 indicates the significance threshold (see methods). Based on the random permutation test (see methods), all r averages (by kinematic parameter for each signal) were above chance except LF decoding of x-position using MI data (average = 0.196). We also plot the r for MI vs. PMv comparing decoding performance in the same session, by signal type (E) or by kinematic parameter (F). Note that decoding performance for both grasp aperture and reach parameters was comparable across PMv and MI.
Fig. 5.
Fig. 5.
Comparison of greedy-selection decoding vs. average-case decoding. A and B: comparison of decoding performance using an average-case approach (see methods) instead of the greedy-selection approach used in previous figures for 1–5 inputs to highlight the relationship in the mean decoding performance between the signals (A) and 1–30 inputs to demonstrate the relationship with larger numbers of inputs (B). Note that for very few inputs (<4), average decoding performance based on LFPs is not significantly different from that based on spikes, but with ≥17 inputs spikes outperform LFP-based decoders. C: similar comparison using a greedy-selection approach. Note that spikes outperform LFP-based decoders at all numbers of inputs. D: comparison of the best performance using the average-case approach and the greedy approach for the same data (comparing data for 8 kinematic parameters, 4 signal types, 2 areas each in 4 sessions). Note that all points are above the diagonal, indicating that the greedy approach performed better than the average-case approach. E and F: fractions of inputs required for each reconstruction to attain 95% of its maximum correlation coefficient achievable with up to a maximum of 50 inputs vs. maximum correlation coefficient for average (E) and greedy-selection-based (F) decoding. Starred markers represent medians on each axis for each signal. Note that the lower fractions of inputs for the greedy-selection-based decoding indicate that maximal decoding performance is achieved with fewer inputs with the greedy approach compared with the average-case approach.
Fig. 6.
Fig. 6.
Examples of hybrid decoders. This figure illustrates the effect of using from both areas MI and PMv, optimal combinations of spiking activity [multiarea (MA) spikes], only multiband LFPs (mb-LFPs), or SA and mb-LFPs [hybrid signal (HS)]. Examples of true and decoded z-position and aperture are shown for the same time segment as displayed in Fig. 2. Original kinematics in black, decoded in gray. r values were computed on the entire reconstruction for each parameter and not just for the time segment displayed here.
Fig. 7.
Fig. 7.
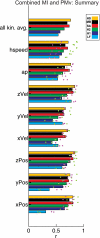
Summary of hybrid decoding. Decoding performance when pooling the same type of signal across MI and PMv or using all (LF, H1, and H2) field potentials (MB) or all signals (HS) from both areas in 2 monkeys (monkey C, light green; monkey G, magenta).
Fig. 8.
Fig. 8.
Improvements when using multiarea (MI and PMv) decoders. A: improvement in decoding performance (Δr) when pooling across areas (MA) vs. the better of MI and PMv decoding performance for each signal in each session (mean ± SE: 0.03 ± 0.03). B: improvement in decoding performance when pooling across areas (MA) vs. the worse of MI and PMv decoding performance for each signal in each session (0.15 ± 0.08). Note that the improvement compared with the worse area is significantly greater than the improvement compared with the better area. Note also that the better area could be either MI or PMv for each session/monkey/kinematic parameter and neither area was always better (see Fig. 4, E and F). Each plot is a box and whisker plot. The box represents the 25th and 75th percentile range of the values obtained for r across monkeys, sessions, and kinematic variables. The line inside the box represents the median, and the whiskers extend to ±2.7σ, or up to points not considered outliers (which in turn are plotted as plus signs).
Fig. 9.
Fig. 9.
Fractions of inputs of each type of signal from each area in the optimal pool of input signals used for decoding. Fractions of inputs across all kinematic parameters that came from PMv vs. MI in the multiarea decoder (MA) for each neural signal (A), all field potential bands-based decoder (mb-LFP; B), or all signals-based decoder (HS; C), for a maximum pool of 50 inputs that were tested with the greedy procedure. Pie chart plots the mean proportion of each type of signal (out of all selected signals) selected by the corresponding decoder. Reach refers to the average fractions obtained for decoding across x, y, and z positions, x, y, and z velocities, and hand speed. Grasp refers to similar average fractions for decoding aperture. A slight overall bias for PMv spikes for both reach and grasp was observed, in part due to the reduced number of units in monkey G, MI, session 2. However, there were no differences in this bias for reach vs. grasp.
Fig. 10.
Fig. 10.
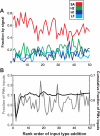
Composition of the optimal input pool for hybrid signal (HS) decoding by signal type and cortical area. The order in which the inputs were added to the HS pool to decode each signal for each session with the greedy-selection algorithm (see methods) is shown. A: summary of fractions of inputs of each signal type added at each rank. B: summary of fractions of inputs added at each rank from PMv (gray) and the corresponding cumulative fraction of PMv inputs added (black).

References

    1. Ajiboye A, Hochberg LR, Donoghue JP, Kirsch RF. Application of system identification methods for decoding imagined single-joint movements in an individual with high tetraplegia. Conf Proc IEEE Eng Med Biol Soc 2010: 2678–2681, 2010 - PMC - PubMed
    1. Artemiadis P, Shakhnarovich G, Vargas-Irwin C, Black M, Donoghue J. Decoding grasp aperture from motor-cortical population activity. Third International IEEE EMBS Conference on Neural Engineering, p. 518–521, 2007
    1. Bansal AK, Vargas-Irwin CE, Truccolo W, Donoghue JP. Relationships among low-frequency local field potentials, spiking activity, and three-dimensional reach and grasp kinematics in primary motor and ventral premotor cortices. J Neurophysiol 105: 1603–1619, 2011 - PMC - PubMed
    1. Belitski A, Gretton A, Magri C, Murayama Y, Montemurro MA, Logothetis NK, Panzeri S. Low-frequency local field potentials and spikes in primary visual cortex convey independent visual information. J Neurosci 28: 5696–5709, 2008 - PMC - PubMed
    1. Belitski A, Panzeri S, Magri C, Logothetis NK, Kayser C. Sensory information in local field potentials and spikes from visual and auditory cortices: time scales and frequency bands. J Comput Neurosci 29: 533–545, 2010 - PMC - PubMed

Publication types

LinkOut - more resources