. 2012 Feb 17;287(8):5650-60.
doi: 10.1074/jbc.M111.264473. Epub 2011 Dec 8.

Structural basis for increased toxicity of pathological aβ42:aβ40 ratios in Alzheimer disease

Affiliations

Structural basis for increased toxicity of pathological aβ42:aβ40 ratios in Alzheimer disease

Kris Pauwels et al. J Biol Chem. .

Abstract

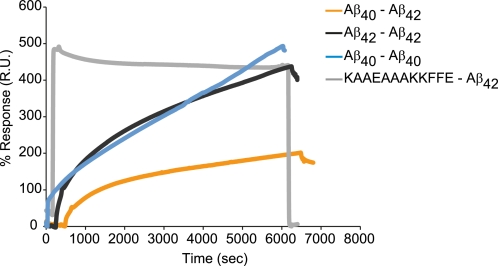
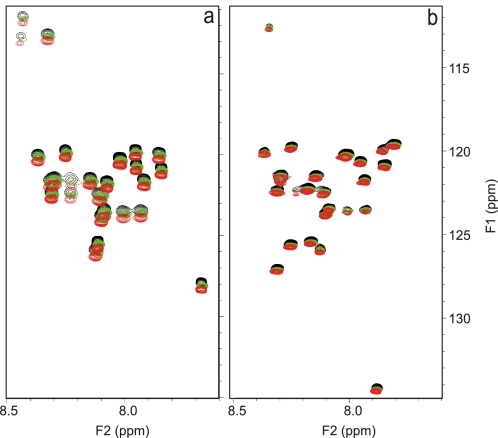
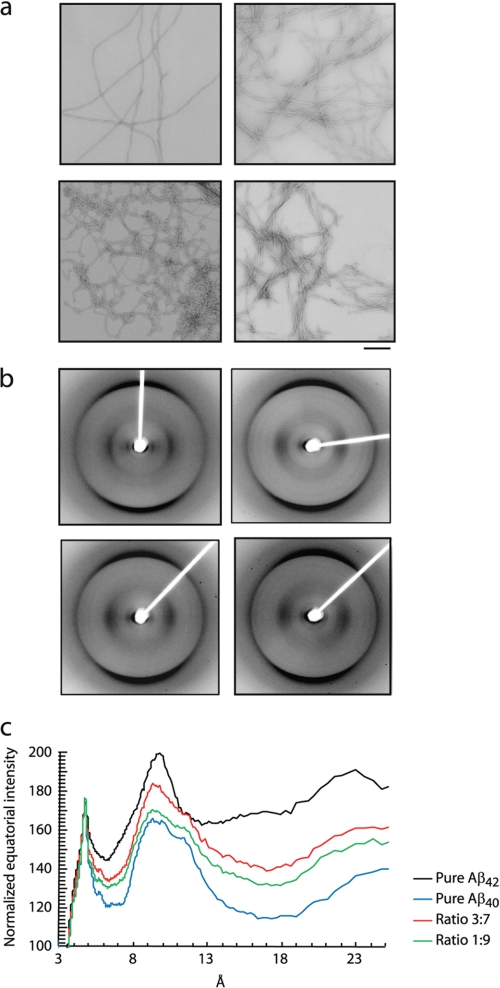
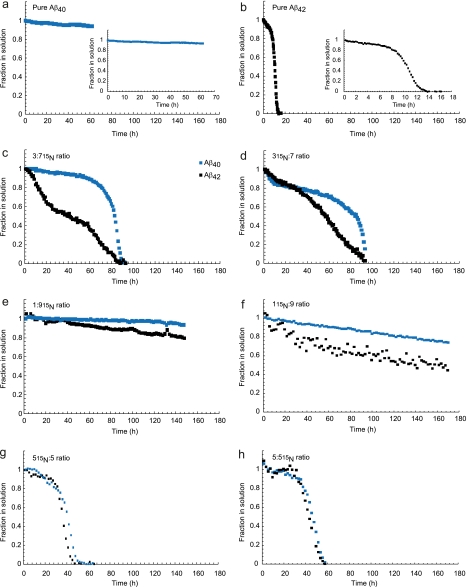
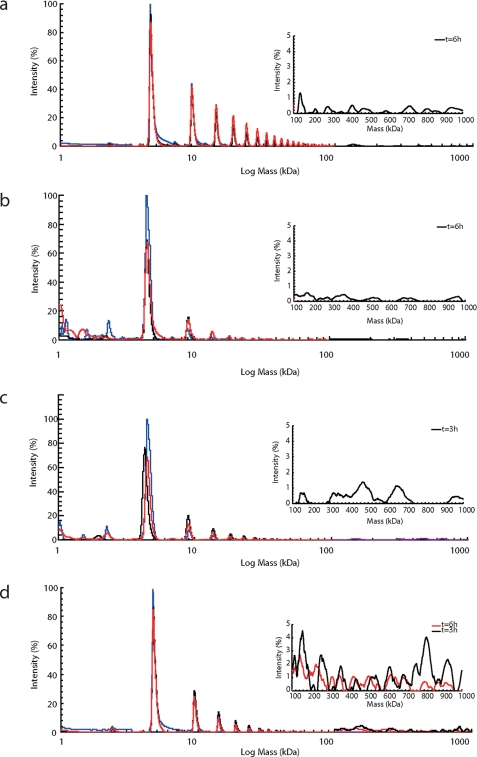
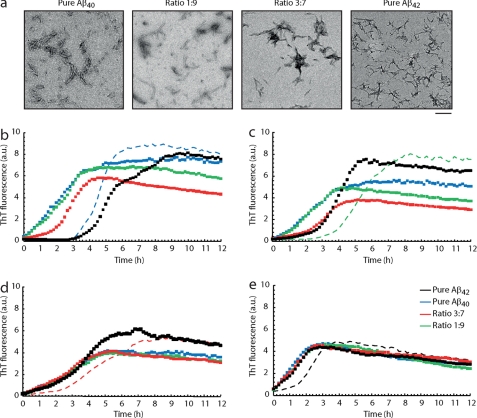
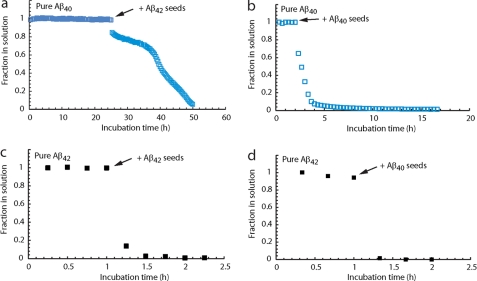
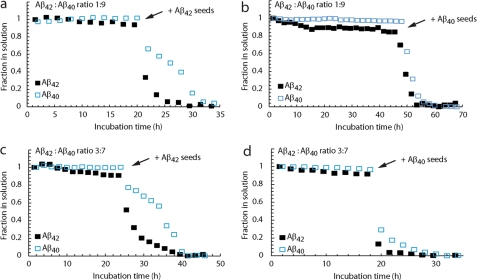
The β-amyloid peptide (Aβ) is directly related to neurotoxicity in Alzheimer disease (AD). The two most abundant alloforms of the peptide co-exist under normal physiological conditions in the brain in an Aβ(42):Aβ(40) ratio of ∼1:9. This ratio is often shifted to a higher percentage of Aβ(42) in brains of patients with familial AD and this has recently been shown to lead to increased synaptotoxicity. The molecular basis for this phenomenon is unclear. Although the aggregation characteristics of Aβ(40) and Aβ(42) individually are well established, little is known about the properties of mixtures. We have explored the biophysical and structural properties of physiologically relevant Aβ(42):Aβ(40) ratios by several techniques. We show that Aβ(40) and Aβ(42) directly interact as well as modify the behavior of the other. The structures of monomeric and fibrillar assemblies formed from Aβ(40) and Aβ(42) mixtures do not differ from those formed from either of these peptides alone. Instead, the co-assembly of Aβ(40) and Aβ(42) influences the aggregation kinetics by altering the pattern of oligomer formation as evidenced by a unique combination of solution nuclear magnetic resonance spectroscopy, high molecular weight mass spectrometry, and cross-seeding experiments. We relate these observations to the observed enhanced toxicity of relevant ratios of Aβ(42):Aβ(40) in synaptotoxicity assays and in AD patients.


Figures

FIGURE 1.
FIGURE 1.
40 and Aβ42 interact directly. 10 μm covalently tethered biotinylated Aβ40 or Aβ42 to streptavidin-coated SA chips show binding between 10 μm Aβ variants. The sensorgram presents the interaction between Aβ40-Aβ42 (orange), Aβ42-Aβ42 (black), Aβ40-Aβ40 (blue), and the negative control nonspecific binding between Aβ42-KAAEAAAKKFFE (gray).
FIGURE 2.
FIGURE 2.
The monomeric structures of Aβ42:Aβ40 ratios are identical at atomic level. Shown is the overlay of the 1H-15N HSQC spectra immediately after sample preparation of a, 15N-labeled Aβ40 in pure Aβ40 sample (black), ratio 1:9(15 N) (green) and ratio 3:7(15 N) (red). b, 15N-labeled Aβ42 in pure Aβ42 sample (black), ratio 1(15 N):9 (red), and ratio 3(15 N):7 (green). For representation purposes and clarity, we have artificially introduced a systematic shift of the spectra of the 1:9 and 3:7 Aβ42:Aβ40 ratios.
FIGURE 3.
FIGURE 3.
Morphology and detailed structure analysis of fibrils of Aβ42:Aβ40 ratios reveals similar structural characteristics. a, TEM images of Aβ ratios obtained upon aggregation for 2 weeks at 25 °C without agitation. Top left panel, pure Aβ40; top right panel, ratio 1:9; bottom left panel, ratio 3:7; bottom right panel, pure Aβ42. Bar, 200 nm. b, fiber diffraction patterns of Aβ ratios obtained upon aggregation for 4 weeks at 25 °C without agitation. Top left panel, pure Aβ40; top right panel, ratio 1:9; bottom left panel, ratio 3:7; bottom right panel, pure Aβ42. c, overlay showing the normalized x-ray scattering intensity function of D-spacing plotted from b.
FIGURE 4.
FIGURE 4.
40 and Aβ42 show different aggregation behavior in different Aβ42:Aβ40 ratios. a, pure Aβ40 at a concentration of 180 μm does not aggregate within the timeframe of data collection. b, pure Aβ42 at a concentration of 20 μm displays a lag phase and a sigmoidal transition from monomeric species into NMR invisible aggregates. c, 3:7(15 N) ratio, whereby the Aβ sample is composed of 70% 15N-labeled Aβ40, which is monitored via HSQC (140 μm40 monomer concentration) and 30% unlabeled Aβ42 (at a monomer concentration of 60 μm), which is simultaneously monitored via the amide region 15N-filtered one-dimensional NMR spectrum. d, the 3(15 N):7 ratio whereby the Aβ sample is composed of 30% 15N-labeled Aβ42 and 70% unlabeled Aβ40. e, the 1:9(15 N) ratio with 10% unlabeled Aβ42 (20 μm) and 90% 15N-labeled Aβ40 (180 μm). f, the 1(15 N):9 ratio with 10% 15N-labeled Aβ42 and 90% unlabeled Aβ40. g, the 5(15 N):5 ratio whereby the 15N-labeled Aβ42 and unlabeled Aβ40 are present in equimolar amounts (60 μm of each alloform). h, the 5:5(15 N) ratio whereby equimolar amounts (60 μm) of unlabeled Aβ42 and 15N-labeled Aβ40 are present. The blue symbols represent Aβ40, and the black symbols correspond to Aβ42.
FIGURE 5.
FIGURE 5.
Oligomer formation by Aβ42:Aβ40 ratios shows a monomer addition process and a dynamic distribution of oligomeric species. Mass spectra of the different ratios with the high molecular weight detection spectra as insets whereby the blue trace is t = 1 h, the black trace is t = 3 h, and the red trace is t = 6 h. a, pure Aβ40; b, 1:9 ratio; c, 3:7 ratio; d, pure Aβ42. These aggregation patterns for the different ratios are also presented in supplemental Table S1.
FIGURE 6.
FIGURE 6.
Cross-seeding reveals that Aβ42 oligomers show plasticity, whereas Aβ40 oligomers display a higher selectivity. a, TEM of seed preparations. Seeds were prepared by incubation of 50 μm Aβ ratios for 24 h followed by sonication at maximum power for 10 min. From left to right: pure Aβ40, ratio 1:9; ratio 3:7, pure Aβ42. Bar, 0.2 μm. Freshly prepared seeds were added to monomeric solutions of Aβ42:Aβ40 ratios at final concentrations of 0.5 μm and 25 μm, respectively. b, ThT of Aβ40 monomers seeded with pure Aβ40 seeds (blue dotted trace); with seeds from ratio 1:9 (green dotted trace), with seeds from ratio 3:7 (red dotted trace), and with seeds from pure Aβ42 (black dotted trace). The blue dashed line represents the unseeded Aβ40 control. c, ThT of ratio 1:9 monomers seeded with Aβ ratios as compared with the non-seeded aggregation curve. The colors are as described in b. d, ThT of ratio 3:7 monomers seeded with Aβ ratios as compared with the non-seeded aggregation curve (red dashed line). Colors are as described in b. e, ThT of Aβ42 monomers seeded with Aβ ratios in comparison with the non-seeded sample (black dashed line). Colors are as described in b.
FIGURE 7.
FIGURE 7.
Cross-seeding was monitored by NMR by recording one-dimensional proton spectra as a function of time with unlabeled pure Aβ40 (a and b) and pure Aβ42 (c and d) monomers using preformed Aβ40 seeds (b and d) and Aβ42 seeds (a and c). Pure Aβ40 samples (blue) were prepared at a concentration of 180 μm, whereas pure Aβ42 samples (black) were at a concentration of 20 μm. The addition of 10% (v/v) of a 50 μm (monomeric equivalent) seed preparation was added at the time points indicated by the arrow.
FIGURE 8.
FIGURE 8.
Cross-seeding was monitored by 15N-filtered and 15N-edited NMR experiments with Aβ samples composed of the Aβ42:Aβ40 ratio 1(15 N):9 (a and b), whereby 20 μm15N-labeled Aβ42 is present with 180 μm unlabeled Aβ40 and the Aβ42:Aβ40 ratio 3(15 N):7 (c and d) with 60 μm15N-labeled Aβ42 and 140 μm unlabeled Aβ40. The addition of 10% (v/v) of a 50 μm (monomeric equivalent) preparation of preformed Aβ40 seeds (b and d) and Aβ42 seeds (a and c) is indicated by the arrows.

References

    1. McLean C. A., Cherny R. A., Fraser F. W., Fuller S. J., Smith M. J., Beyreuther K., Bush A. I., Masters C. L. (1999) Soluble pool of Aβ amyloid as a determinant of severity of neurodegeneration in Alzheimer disease. Ann. Neurol. 46, 860–866 - PubMed
    1. Lambert M. P., Barlow A. K., Chromy B. A., Edwards C., Freed R., Liosatos M., Morgan T. E., Rozovsky I., Trommer B., Viola K. L., Wals P., Zhang C., Finch C. E., Krafft G. A., Klein W. L. (1998) Diffusible, nonfibrillar ligands derived from Aβ1–42 are potent central nervous system neurotoxins. Proc. Natl. Acad. Sci. U.S.A. 95, 6448–6453 - PMC - PubMed
    1. Klyubin I., Betts V., Welzel A. T., Blennow K., Zetterberg H., Wallin A., Lemere C. A., Cullen W. K., Peng Y., Wisniewski T., Selkoe D. J., Anwyl R., Walsh D. M., Rowan M. J. (2008) Amyloid β protein dimer-containing human CSF disrupts synaptic plasticity: prevention by systemic passive immunization. J. Neurosci. 28, 4231–4237 - PMC - PubMed
    1. Shankar G. M., Li S., Mehta T. H., Garcia-Munoz A., Shepardson N. E., Smith I., Brett F. M., Farrell M. A., Rowan M. J., Lemere C. A., Regan C. M., Walsh D. M., Sabatini B. L., Selkoe D. J. (2008) Amyloid β protein dimers isolated directly from Alzheimer brains impair synaptic plasticity and memory. Nat. Med. 14, 837–842 - PMC - PubMed
    1. Lashuel H. A., Hartley D., Petre B. M., Walz T., Lansbury P. T., Jr. (2002) Nature 418, 291. - PubMed

Publication types

MeSH terms