. 2012 Feb 15;31(4):788-804.
doi: 10.1038/emboj.2011.456. Epub 2011 Dec 13.

Mechanoinduction of lymph vessel expansion

Affiliations

Mechanoinduction of lymph vessel expansion

Lara Planas-Paz et al. EMBO J. .

Abstract

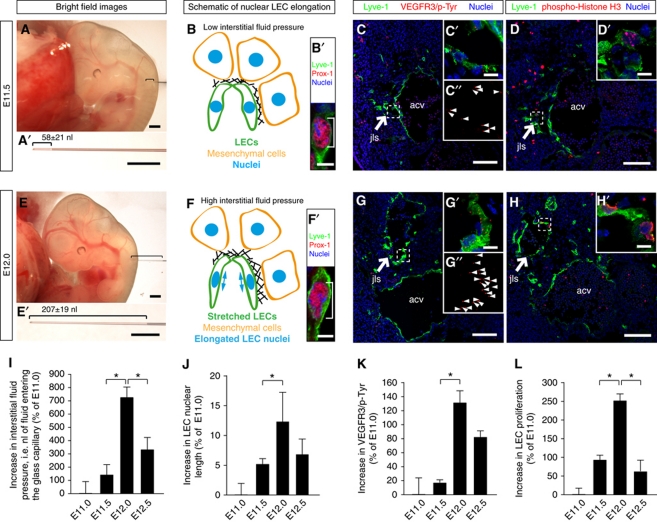
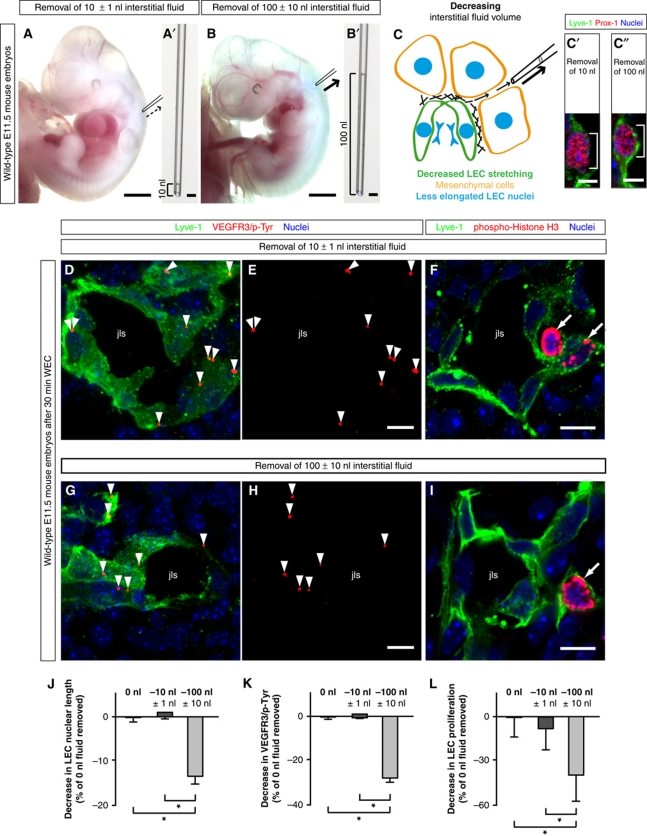
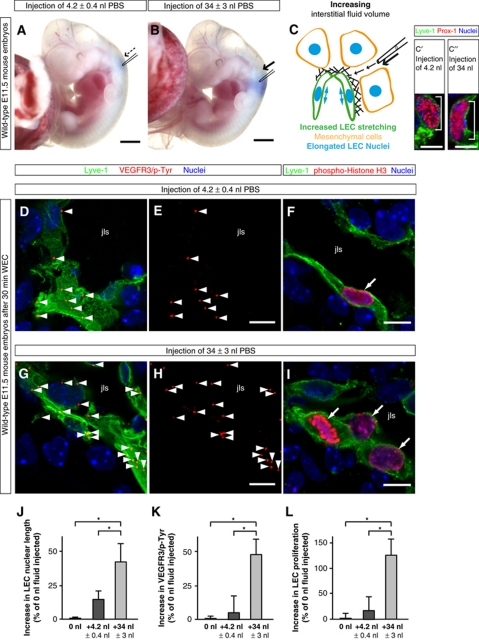
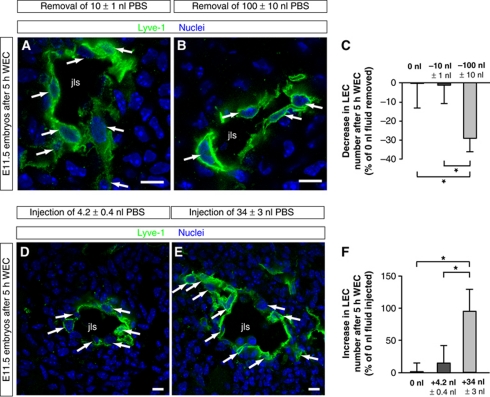
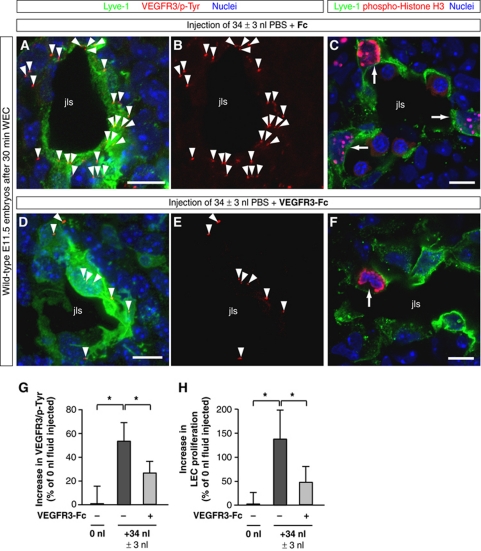
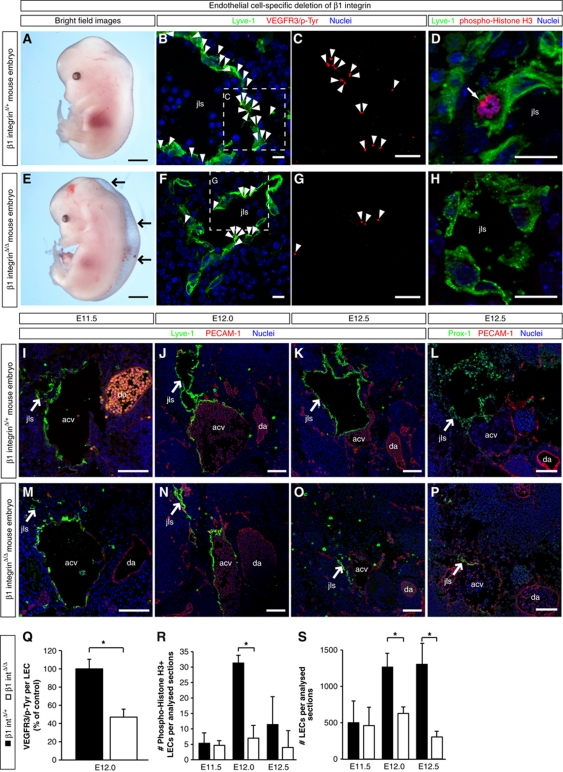
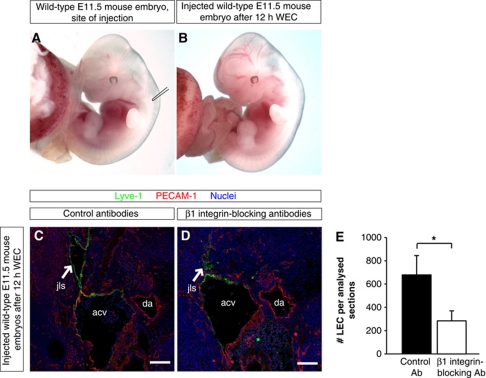
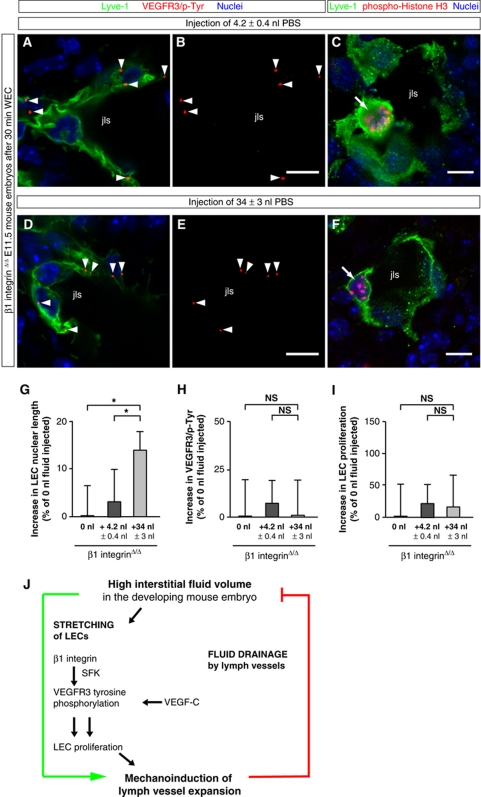
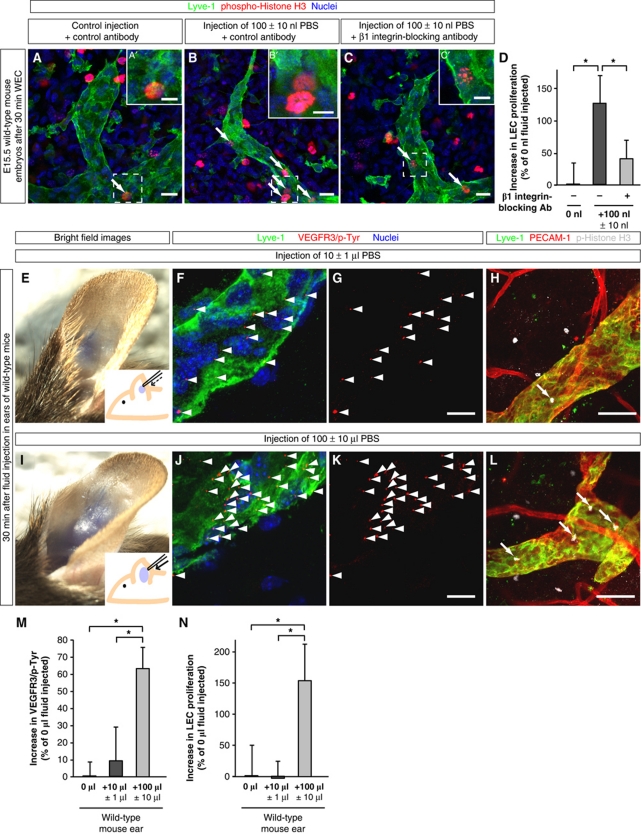
In the mammalian embryo, few mechanical signals have been identified to influence organ development and function. Here, we report that an increase in the volume of interstitial or extracellular fluid mechanically induces growth of an organ system, that is, the lymphatic vasculature. We first demonstrate that lymph vessel expansion in the developing mouse embryo correlates with a peak in interstitial fluid pressure and lymphatic endothelial cell (LEC) elongation. In 'loss-of-fluid' experiments, we then show that aspiration of interstitial fluid reduces the length of LECs, decreases tyrosine phosphorylation of vascular endothelial growth factor receptor-3 (VEGFR3), and inhibits LEC proliferation. Conversely, in 'gain-of-fluid' experiments, increasing the amount of interstitial fluid elongates the LECs, and increases both VEGFR3 phosphorylation and LEC proliferation. Finally, we provide genetic evidence that β1 integrins are required for the proliferative response of LECs to both fluid accumulation and cell stretching and, therefore, are necessary for lymphatic vessel expansion and fluid drainage. Thus, we propose a new and physiologically relevant mode of VEGFR3 activation, which is based on mechanotransduction and is essential for normal development and fluid homeostasis in a mammalian embryo.


Conflict of interest statement

The authors declare that they have no conflict of interest.

Figures

Figure 1
Figure 1
Interstitial fluid pressure and lymphatic endothelial cell elongation correlate with lymph vessel expansion in the developing mouse embryo. (A, E) Representative bright field images of (A) E11.5 and (E) E12.0 wild-type mouse embryos. A glass micro-capillary was inserted into the mesenchyme in which a jugular lymph sac (jls) develops, and the nanoliters of interstitial fluid that entered the glass capillary were measured. The amount of interstitial fluid entering the glass capillary at E11.5 and E12.0 is displayed in (A′) and (E′), respectively. Scale bars, 500 μm. (B, F) Schematic illustration of LEC stretching and nuclear elongation at (B) E11.5 and (F) E12.0 of mouse embryonic development. (B′, F′) Laser scanning microscopy (LSM) images of LECs immunostained for the lymphatic markers Lyve-1 (green) and Prox-1 (red) to visualize the nuclear elongation at (B′) E11.5 and (F′) E12.0 of mouse embryonic development. Scale bars, 5 μm. (C, G) Representative LSM images of proximity ligation assays (PLA) on cross-sections through the jugular lymph sacs (jls) of wild-type (C) E11.5 and (G) E12.0 mouse embryos. Arrows point to the jugular lymph sac (jls) immunostained for Lyve-1 (green). The anterior cardinal vein (acv) is also indicated. Scale bars, 100 μm. (C′, C″, G′, G″) Magnification of (C) and (G). Red staining (arrowheads) indicates sites of VEGFR3 with phosphorylated tyrosines. Scale bars, 10 μm. (D, H) Cross-sections through the jugular lymph sac (jls) of representative wild-type (D) E11.5 and (H) E12.0 mouse embryos, immunostained for Lyve-1 (green), proliferation marker phospho-histone H3 (red) and nuclei (DAPI, blue). Scale bars, 100 μm. (D′, H′) Magnification of (D) and (H). Scale bars, 10 μm. (I) Increase in interstitial fluid pressure in wild-type mouse embryos at the indicated stages of embryonic development. Interstitial fluid pressure was measured as the nanoliters of fluid entering a glass capillary. All values are means±s.d., n⩾11 embryos per stage, *P<0.05 (first bracket: P=0.001, second bracket: P=0.038). (J) Increase in LEC nuclear length in wild-type mouse embryos at the indicated stages of embryonic development. All values are means±s.d., n=130–300 cells per embryo in a total of three embryos per stage, *P=0.032. (K) Increase in sites of VEGFR3 with phosphorylated tyrosines in LECs of wild-type mouse embryos at the indicated stages of embryonic development. All values are means±s.d., n=3 embryos per stage, *P=0.037. (L) Increase in LEC proliferation in wild-type mouse embryos at the indicated stages of development. All values are means±s.d., n⩾3 embryos per stage, *P<0.05 (first bracket: P=0.004, second bracket: P=0.006).
Figure 2
Figure 2
‘Loss-of-fluid’ experiments: Lowering the interstitial fluid volume reduces LEC elongation, and decreases VEGFR3 tyrosine phosphorylation and LEC proliferation. (A, B) Representative bright field images of wild-type E11.5 mouse embryos, in which (A) 10 nl and (B) 100 nl interstitial fluid was removed from the area of lymphatic development. Scale bars, 1 mm. The amount of fluid taken from the interstitium is displayed in (A′) and (B′). Scale bars, 10 μm. (C) Schematic illustration of the removal of interstitial fluid from embryonic tissue using a glass micro-capillary. When the interstitial fluid pressure is reduced, the LECs are less stretched, and their nuclei are less elongated. (C′, C″) Laser scanning microscopy (LSM) images of LECs immunostained for Lyve-1 (green) and Prox-1 (red) to visualize the nuclear shortening when (C″) 100 nl interstitial fluid was removed compared with (C′) the removal of 10 nl interstitial fluid. Scale bars, 5 μm. (D, E, G, H) Representative LSM images of proximity ligation assays (PLA) on cross-sections through the jugular lymph sacs (jls) of wild-type E11.5 mouse embryos, from which (D, E) 10 nl or (G, H) 100 nl interstitial fluid was removed, and cultivated for 30 min in whole embryo culture (WEC). Red staining (arrowheads) indicates sites of VEGFR3 with phosphorylated tyrosines. Co-staining is shown for the lymphatic marker Lyve-1 (green) and nuclei (DAPI, blue). Scale bars, 10 μm. (F, I) Cross-sections through the jugular lymph sac (jls) of representative wild-type E11.5 mouse embryos, from which (F) 10 nl or (I) 100 nl interstitial fluid was removed, and immunostained for Lyve-1 (green), proliferation marker phospho-histone H3 (red) and nuclei (DAPI, blue). Proliferating cells are indicated (arrows). Scale bars, 10 μm. (J) Decrease in LEC nuclear length in wild-type E11.5 mouse embryos, from which 10 nl (dark grey column) or 100 nl interstitial fluid (light grey column) was removed compared with untreated wild-type E11.5 mouse embryos (black column). All values are means±s.d., n=50–200 cells per embryo in a total of three embryos per condition, *P<0.05 (first bracket: P=0.001, second bracket: P=0.002). (K) Decrease in sites of VEGFR3 with phosphorylated tyrosines in LECs of wild-type E11.5 mouse embryos from which 10 nl (dark grey column) or 100 nl interstitial fluid (light grey column) was removed compared with untreated wild-type E11.5 mouse embryos (black column). All values are means±s.d., n=3 embryos per condition, *P<0.05 (first bracket: P=0.008, second bracket: P=0.019). (L) Decrease in LEC proliferation in wild-type E11.5 mouse embryos, from which 10 nl (dark grey column) or 100 nl interstitial fluid (light grey column) was removed compared with untreated wild-type E11.5 mouse embryos (black column). All values are means±s.d., n=3 embryos per condition, *P<0.05 (first bracket: P=0.019, second bracket: P=0.04).
Figure 3
Figure 3
‘Gain-of-fluid’ experiments: Increasing the interstitial fluid volume elongates LECs, and enhances VEGFR3 tyrosine phosphorylation and LEC proliferation. (A, B) Representative bright field images of wild-type E11.5 mouse embryos in which (A) 4.2 nl PBS or (B) 34 nl PBS was injected together with Fast Green dye next to the jugular lymph sac. Scale bars, 1 mm. (C) Schematic illustration of the addition of fluid to embryonic tissue using a glass micro-capillary. When the interstitial fluid pressure is increased, the LECs are stretched, and their nuclei are elongated. (C′, C″) Laser scanning microscopy (LSM) images of LECs immunostained for Lyve-1 (green) and Prox-1 (red) to visualize the nuclear elongation when (C″) 34 nl interstitial fluid was injected compared with (C′) the injection of 4.2 nl interstitial fluid. Scale bars, 5 μm. (D, E, G, H) Representative LSM images of proximity ligation assays (PLA) on cross-sections through the jugular lymph sacs (jls) of wild-type E11.5 mouse embryos injected with (D, E) 4.2 nl PBS or (G, H) 34 nl PBS, and cultivated for 30 min in whole embryo culture (WEC). Red staining (arrowheads) indicates sites of VEGFR3 with phosphorylated tyrosines. A co-staining is shown for the lymphatic marker Lyve-1 (green) and nuclei (DAPI, blue). Scale bars, 10 μm. (F, I) Cross-sections through the jugular lymph sac (jls) of representative wild-type E11.5 mouse embryos injected with (F) 4.2 nl PBS or (I) 34 nl PBS, and immunostained for Lyve-1 (green), proliferation marker phospho-histone H3 (red) and nuclei (DAPI, blue). Proliferating cells are indicated (arrows). Scale bars, 10 μm. (J) Increase in LEC nuclear length in wild-type E11.5 mouse embryos injected with 4.2 nl PBS (dark grey column) or 34 nl PBS (light grey column) compared with untreated wild-type E11.5 mouse embryos (black column). All values are means±s.d., n=20–200 cells per embryo in a total of ⩾3 embryos per condition, *P<0.05 (first bracket: P=0.013, second bracket: P=0.031). (K) Increase in sites of VEGFR3 with phosphorylated tyrosines in LECs of wild-type E11.5 mouse embryos injected with 4.2 nl PBS (dark grey column) or 34 nl PBS (light grey column) compared with untreated wild-type E11.5 mouse embryos (black column). All values are means±s.d., n⩾3 embryos per condition, *P<0.05 (first bracket: P=0.0004, second bracket: P=0.00009). (L) Increase in LEC proliferation in wild-type E11.5 mouse embryos injected with 4.2 nl PBS (dark grey column) or 34 nl PBS (light grey column) compared with untreated wild-type E11.5 mouse embryos (black column). All values are means±s.d., n=3 embryos per condition, *P<0.05 (first bracket: P=0.032, second bracket: P=0.025).
Figure 4
Figure 4
‘Loss-’ and ‘gain-of-fluid’ experiments: Lowering the interstitial fluid volume reduces the number of LECs, whereas increasing the interstitial fluid volume enhances their number. (A, B) Cross-sections through the jugular lymph sac (jls) of representative wild-type E11.5 mouse embryos, from which (A) 10 nl or (B) 100 nl interstitial fluid was removed. The embryos were subsequently cultivated for 5 h in WEC, and immunostained for Lyve-1 (green) and nuclei (DAPI, blue). Arrows point to LECs. Scale bars, 10 μm. (C) Decrease in LEC number in wild-type E11.5 mouse embryos, from which 10 nl (dark grey column) or 100 nl interstitial fluid (light grey column) was removed compared with untreated wild-type E11.5 mouse embryos (black column). All values are means±s.d., n=3 embryos per condition, *P<0.05 (first bracket: P=0.047, second bracket: P=0.026). (D, E) Cross-sections through the jugular lymph sac (jls) of representative wild-type E11.5 mouse embryos injected with (D) 4.2 nl PBS or (E) 34 nl PBS. The embryos were subsequently cultivated for 5 h in WEC, and immunostained for Lyve-1 (green) and nuclei (DAPI, blue). Arrows point to LECs. Scale bars, 10 μm. (F) Increase in LEC number in wild-type E11.5 mouse embryos injected with 4.2 nl PBS (dark grey column) or 34 nl PBS (light grey column) compared with untreated wild-type E11.5 mouse embryos (black column). All values are means±s.d., n⩾3 embryos per condition, *P<0.05 (first bracket: P=0.027, second bracket: P=0.026).
Figure 5
Figure 5
‘Gain-of-fluid’ experiments: VEGFR3-Fc reduces VEGFR3 tyrosine phosphorylation and LEC proliferation in response to an increased interstitial fluid volume. (A, B, D, E) Representative LSM images of proximity ligation assays (PLA) on cross-sections through jugular lymph sacs (jls) of wild-type E11.5 mouse embryos injected with (A, B) 34 nl PBS and control Fc protein or (D, E) 34 nl PBS and VEGFR3-Fc, and cultivated for 30 min in WEC. Red staining (arrowheads) indicates sites of VEGFR3 with phosphorylated tyrosines in LECs stained for Lyve-1 (green) and nuclei (DAPI, blue). Scale bars, 10 μm. (C, F) Cross-sections through jugular lymph sacs (jls) of representative wild-type E11.5 mouse embryos injected with (C) 34 nl PBS and control Fc protein or (F) 34 nl PBS and VEGFR3-Fc, and immunostained for Lyve-1 (green), proliferation marker phospho-histone H3 (red) and nuclei (DAPI, blue). Proliferating cells are indicated (arrows). Scale bars, 10 μm. (G) Increase in PLA sites of VEGFR3 with phosphorylated tyrosines in LECs of wild-type E11.5 mouse embryos injected with 34 nl PBS and control Fc protein (dark grey column) or 34 nl PBS and VEGFR3-Fc (light grey column) compared with untreated wild-type E11.5 mouse embryos (black column). All values are means±s.d., n⩾3 embryos per condition, *P<0.05 (first bracket: P=0.011, second bracket: P=0.045). (H) Increase in LEC proliferation in wild-type E11.5 mouse embryos injected with 34 nl PBS and control Fc protein (dark grey column) or 34 nl PBS and VEGFR3-Fc (light grey column) compared with untreated wild-type E11.5 mouse embryos (black column). All values are means±s.d., n⩾3 embryos per condition, *P<0.05 (first bracket: P=0.019, second bracket: P=0.045).
Figure 6
Figure 6
β1 integrin is required for interstitial fluid homeostasis and lymph vessel expansion. (A, E) Representative bright field images of the following mouse embryos: (A) β1 integrinΔ/+ control E13.5 embryo, containing a heterozygous deletion of β1 integrin in lymphatic endothelial cells (LECs) and (E) β1 integrinΔ/Δ E13.5 embryo, harbouring a homozygous deletion of β1 integrin in LECs. Arrows point to oedema in the dorsolateral part of the β1 integrinΔ/Δ embryo (E). Scale bars, 500 μm. (B, C, F, G) Representative LSM images of proximity ligation assays (PLA) on cross-sections through the jugular lymph sacs (jls) of β1 integrinΔ/+ control E12.0 mouse embryos (B, C) and β1 integrinΔ/Δ E12.0 embryos (F, G). Red staining (arrowheads) indicates the sites of VEGFR3 with phosphorylated tyrosines. A co-staining is shown for the lymphatic marker Lyve-1 (green) and nuclei (DAPI, blue). (C, G) Magnified areas of (B) and (F), respectively, showing only the PLA. Scale bars, 10 μm. (D, H) Cross-sections through the jugular lymph sac (jls) of (D) a representative β1 integrinΔ/+ control E12.0 mouse embryo and (H) a β1 integrinΔ/Δ E12.0 mouse embryo, immunostained for Lyve-1 (green), proliferation marker phospho-histone H3 (red) and nuclei (DAPI, blue). A proliferating cell is indicated (arrow). Scale bars, 20 μm. (IP) Representative LSM images of cross-sections through (IL) β1 integrinΔ/+ control embryos and (MP) β1 integrinΔ/Δ embryos. The following stages of jugular lymph sac (jls) formation are shown: (I, M) E11.5, (J, N) E12.0, and (K, L, O, P) E12.5. Arrows point to the jugular lymph sacs (jls) stained for the lymphatic markers (IK, MO) Lyve-1 (green) or (L, P) Prox-1 (green), endothelial marker PECAM-1 (red) and nuclei (DAPI, blue). Anterior cardinal vein (acv) and dorsal aorta (da) are also indicated. Scale bars, 100 μm. (Q) Quantification of the sites of VEGFR3 with phosphorylated tyrosines in LECs of β1 integrinΔ/+ control E12.0 embryos (black column) and β1 integrinΔ/Δ E12.0 embryos (white column). All values are means±s.d., n=3 embryos per genotype, *P=0.032. (R) Quantification of the numbers of proliferating LECs in mouse embryos harbouring a heterozygous (black columns) or homozygous (white columns) deletion of β1 integrin. All values are means±s.d., n=3 embryos per genotype and stage, *P=0.002. (S) Quantification of the total numbers of LECs in mouse embryos harbouring a heterozygous (black columns) or homozygous (white columns) deletion of β1 integrin. All values are means±s.d., n⩾4 embryos per genotype and stage, *P<0.05 (first bracket: P=0.012, second bracket: P=0.007).
Figure 7
Figure 7
β1 integrin is required for lymph vessel expansion as revealed by injection of β1 integrin-blocking antibodies. (A, B) Bright field images of wild-type embryos isolated at E11.5 (A) before injection of antibodies and (B) after the injection and cultivation for 12 h in WEC. (C, D) Representative LSM images of cross-sections through wild-type E11.5 mouse embryos injected with (C) isotype-matched control antibodies or (D) with β1 integrin-blocking antibodies, and cultivated for 12 h in WEC. Arrows point to the jugular lymph sac (jls) stained for the lymphatic marker Lyve-1 (green), endothelial marker PECAM-1 (red), and nuclei (DAPI, blue). Anterior cardinal vein (acv) and dorsal aorta (da) are also indicated. Scale bars, 100 μm. (E) Quantification of the numbers of LECs in mouse embryos injected with isotype-matched control antibodies (black column) or with β1 integrin-blocking antibodies (white column). All values are means±s.d., n=3 mouse embryos per condition, *P=0.008.
Figure 8
Figure 8
‘Gain-of-fluid’ experiments: β1 integrin is required for VEGFR3 tyrosine phosphorylation and LEC proliferation in response to an increased interstitial fluid volume. (A, B, D, E) Representative LSM images of proximity ligation assays (PLA) on cross-sections through jugular lymph sacs (jls) of β1 integrinΔ/Δ E11.5 mouse embryos injected with (A, B) 4.2 nl PBS or (D, E) 34 nl PBS, and cultivated for 30 min in WEC. Red staining (arrowheads) indicates sites of VEGFR3 with phosphorylated tyrosines in LECs that are stained for Lyve-1 (green) and nuclei (DAPI, blue). Scale bars, 10 μm. (C, F) Cross-sections through the jugular lymph sac (jls) of representative β1 integrinΔ/Δ E11.5 mouse embryos injected with (C) 4.2 nl PBS or (F) 34 nl PBS, and immunostained for Lyve-1 (green), proliferation marker phospho-histone H3 (red), and nuclei (DAPI, blue). Proliferating cells are indicated (arrows). Scale bars, 10 μm. (G) Increase in LEC nuclear length in β1 integrinΔ/Δ E11.5 mouse embryos injected with 4.2 nl PBS (dark grey column) or 34 nl PBS (light grey column) compared with untreated β1 integrinΔ/Δ E11.5 mouse embryos (black column). All values are means±s.d., n=50–100 cells per embryo in a total of ⩾3 embryos per condition, *P<0.05 (first bracket: P=0.042, second bracket: P=0.043). (H) Lack of increase in sites of VEGFR3 with phosphorylated tyrosines in LECs of β1 integrinΔ/Δ E11.5 mouse embryos injected with 4.2 nl PBS (dark grey column) or 34 nl PBS (light grey column) compared with untreated β1 integrinΔ/Δ E11.5 mouse embryos (black column). All values are means±s.d., n⩾3 embryos per condition, NS, non-significant (first bracket: P=0.945, second bracket: P=0.430). (I) Lack of increase in LEC proliferation in β1 integrinΔ/Δ E11.5 mouse embryos injected with 4.2 nl PBS (dark grey column) or 34 nl PBS (light grey column) compared with untreated β1 integrinΔ/Δ E11.5 mouse embryos (black column). All values are means±s.d., n⩾3 embryos per condition, NS, non-significant (first bracket: P=0.651, second bracket: P=0.688). (J) Model: Interstitial fluid accumulation mechanoinduces lymph vessel expansion. An increase in interstitial fluid volume mechanically stretches LECs, enhances VEGFR3 tyrosine phosphorylation, and induces LEC proliferation. These steps strictly require β1 integrin. Both VEGF-C and β1 integrin induce VEGFR3 tyrosine phosphorylation, the latter possibly via the Src Family of Kinases (SFK) (data not shown) (Galvagni et al, 2010). The newly formed lymph vessels drain the interstitial fluid, thereby decreasing the interstitial fluid pressure, and preventing formation of oedema.
Figure 9
Figure 9
‘Gain-of-fluid’ experiments: Increasing the interstitial fluid volume enhances LEC proliferation in sprouting lymph vessels in a β1 integrin-dependent manner, and enhances VEGFR3 tyrosine phosphorylation and LEC proliferation in adult lymph vessels. (AC) Skin of E15.5 mouse embryos injected with (A) 0 nl PBS and isotype-matched control antibodies, (B) 100 nl PBS and isotype-matched control antibodies, and (C) 100 nl PBS with β1 integrin-blocking antibodies, and whole-mount immunostained for Lyve-1 (green), proliferation marker phospho-histone H3 (red), and nuclei (DAPI, blue). Scale bars, 20 μm. (A′–C′) Magnification of (AC). Scale bars, 10 μm. (D) Increase in LEC proliferation in the skin of E15.5 mouse embryos injected with 100 nl PBS and isotype-matched control antibodies (dark grey column) or 100 nl PBS and β1 integrin-blocking antibodies (light grey column) compared with control embryos (black column). All values are means±s.d., n=3 mouse embryos per condition, *P<0.05 (first bracket: P=0.019, second bracket: P=0.049). (E, I) Bright field images and schematic illustrations of mouse ears injected with (E) 10 μl PBS or (I) 100 μl PBS together with Fast Green dye. (F, G, J, K) Representative LSM images of proximity ligation assays (PLA) on cross-sections through mouse ears injected with (F, G) 10 μl PBS or (J, K) 100 μl PBS, and collected after 30 min. Red staining (arrowheads) indicates sites of VEGFR3 with phosphorylated tyrosines in LECs that are co-stained for Lyve-1 (green) and nuclei (DAPI, blue). Scale bars, 10 μm. (H, L) Cross-sections through mouse ears injected with (H) 10 μl PBS or (L) 100 μl PBS, and whole-mount immunostained for Lyve-1 (green), PECAM-1 (red), and proliferation marker phospho-histone H3 (grey). Proliferating cells are indicated (arrows). Scale bars, 50 μm. (M) Increase in sites of VEGFR3 with phosphorylated tyrosines in LECs of mouse ears injected with 10 μl PBS (dark grey column) or 100 μl PBS (light grey column) compared with untreated ears (black column). All values are means±s.d., n⩾3 mouse ears per condition, *P<0.05 (first bracket: P=0.0004, second bracket: P=0.022). (N) Increase in LEC proliferation in mouse ears injected with 10 μl PBS (dark grey column) or 100 μl PBS (light grey column) compared with untreated ears (black column). All values are means±s.d., n⩾3 mouse ears per condition, *P<0.05 (first bracket: P=0.003, second bracket: P=0.002).

Comment in

References

    1. Affolter M, Zeller R, Caussinus E (2009) Tissue remodelling through branching morphogenesis. Nat Rev Mol Cell Biol 10: 831–842 - PubMed
    1. Bahram F, Claesson-Welsh L (2010) VEGF-mediated signal transduction in lymphatic endothelial cells. Pathophysiology 17: 253–261 - PubMed
    1. Bazigou E, Xie S, Chen C, Weston A, Miura N, Sorokin L, Adams R, Muro AF, Sheppard D, Makinen T (2009) Integrin-alpha9 is required for fibronectin matrix assembly during lymphatic valve morphogenesis. Dev Cell 17: 175–186 - PMC - PubMed
    1. Calvo CF, Fontaine RH, Soueid J, Tammela T, Makinen T, Alfaro-Cervello C, Bonnaud F, Miguez A, Benhaim L, Xu Y, Barallobre MJ, Moutkine I, Lyytikkä J, Tatlisumak T, Pytowski B, Zalc B, Richardson W, Kessaris N, Garcia-Verdugo JM, Alitalo K et al. (2011) Vascular endothelial growth factor receptor 3 directly regulates murine neurogenesis. Genes Dev 25: 831–844 - PMC - PubMed
    1. Carlson TR, Hu H, Braren R, Kim YH, Wang RA (2008) Cell-autonomous requirement for beta1 integrin in endothelial cell adhesion, migration and survival during angiogenesis in mice. Development 135: 2193–2202 - PMC - PubMed

Publication types

Substances