

Breaking the 'harmony' of TNF-α signaling for cancer treatment
- PMID: 22158049
- PMCID: PMC3962797
- DOI: 10.1038/onc.2011.567
Breaking the 'harmony' of TNF-α signaling for cancer treatment
Abstract
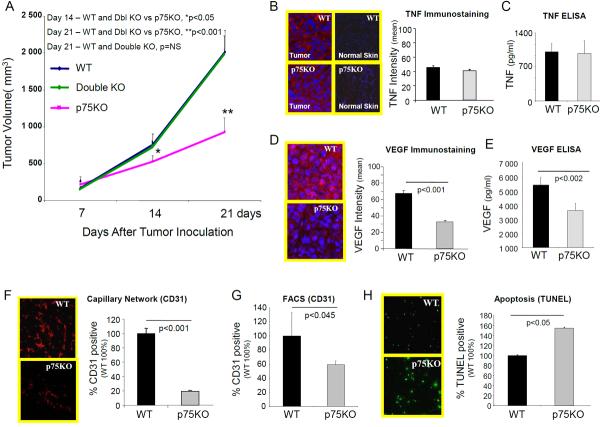
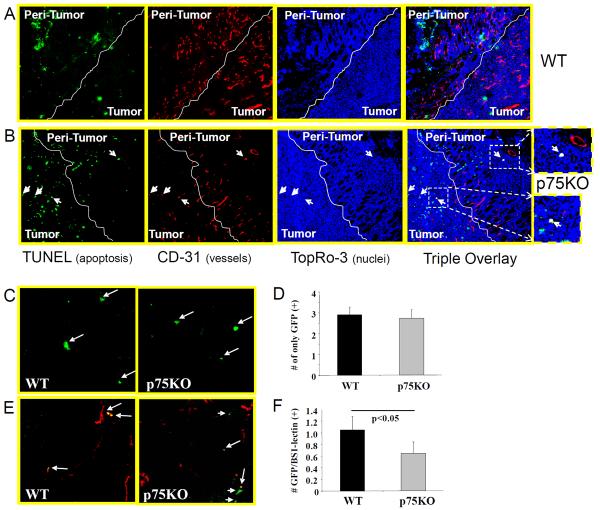
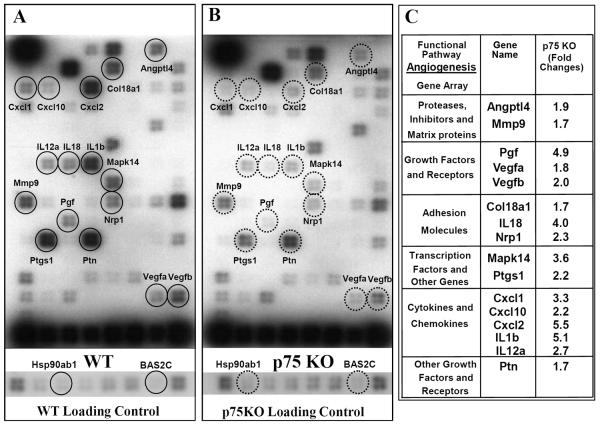
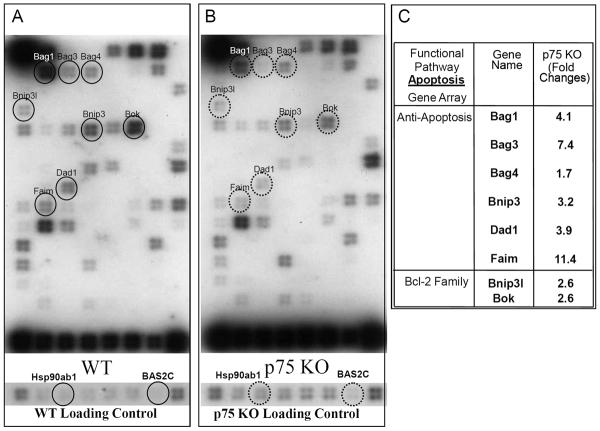
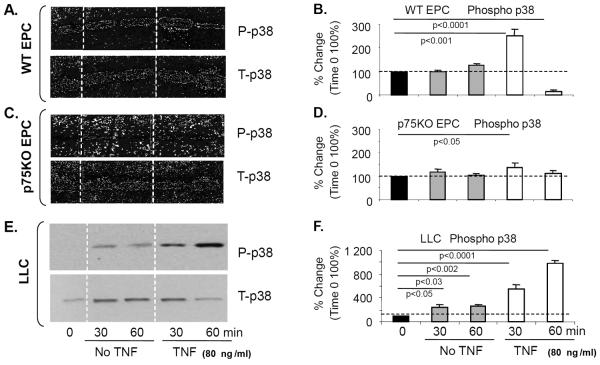
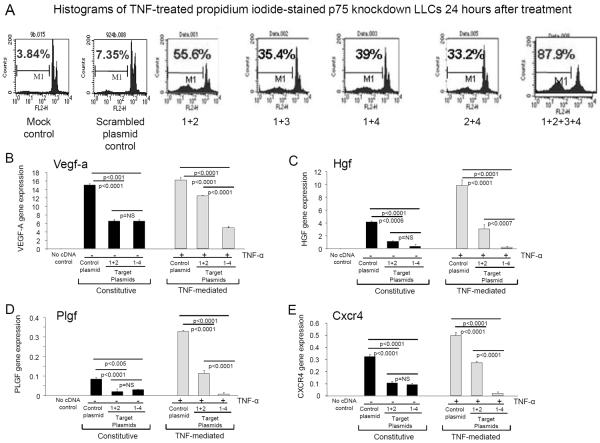
Tumor necrosis factor-alpha (TNF-α) binds to two distinct receptors, TNFR1/p55 and TNFR2/p75. TNF-α is implicated in the processes of tumor growth, survival, differentiation, invasion, metastases, secretion of cytokines and pro-angiogenic factors. We have shown that TNFR2/p75 signaling promotes ischemia-induced angiogenesis via modulation of several angiogenic growth factors. We hypothesized that TNFR2/p75 may promote tumor growth and angiogenesis. Growth of mouse Lewis lung carcinoma (LLC1) and/or mouse melanoma B16 cell was evaluated in wild type (WT), p75 knockout (KO) and double p55KO/p75KO mouse tumor xenograft models. Compared with WT and p55KO/p75KO mice, growth of tumors in p75KO mice was significantly decreased (twofold) in both LLC and B16 tumors. Tumor growth inhibition was correlated with decreases in vascular endothelial growth factor (VEGF) expression and capillary density, as well as bone marrow-derived endothelial progenitor cells incorporation into the functional capillary network, and an increase in apoptotic cells in LLC xenografts. Gene array analysis of tumor tissues showed a decrease in gene expression in pathways that promote tumor angiogenesis and cell survival. Blocking p75 by short-hairpin RNA in cultured LLCs led to increases in TNF-mediated apoptosis, as well as decreases in the constitutive and TNF-mediated expression of angiogenic growth factors (VEGF, HGF, PLGF), and SDF-1α receptor CXCR4. In summary, p75 is essential for tumor angiogenesis and survival in highly vascularized murine lung tumor xenografts. Blocking p75 expression may lead to tumor regression. This may represent new and effective therapy against lung neoplasms and potentially tumors of other origin.
Figures
Similar articles
-
Therapeutic non-toxic doses of TNF induce significant regression in TNFR2-p75 knockdown Lewis lung carcinoma tumor implants.PLoS One. 2014 Mar 24;9(3):e92373. doi: 10.1371/journal.pone.0092373. eCollection 2014. PLoS One. 2014. PMID: 24664144 Free PMC article.
-
TNF-TNFR2/p75 signaling inhibits early and increases delayed nontargeted effects in bone marrow-derived endothelial progenitor cells.J Biol Chem. 2014 May 16;289(20):14178-93. doi: 10.1074/jbc.M114.567743. Epub 2014 Apr 7. J Biol Chem. 2014. PMID: 24711449 Free PMC article.
-
Tumor necrosis factor-alpha receptor p75 is required in ischemia-induced neovascularization.Circulation. 2007 Feb 13;115(6):752-62. doi: 10.1161/CIRCULATIONAHA.106.647255. Epub 2007 Jan 29. Circulation. 2007. PMID: 17261656
-
Targeting tumor micro-environment for design and development of novel anti-angiogenic agents arresting tumor growth.Prog Biophys Mol Biol. 2013 Nov;113(2):333-54. doi: 10.1016/j.pbiomolbio.2013.10.001. Epub 2013 Oct 15. Prog Biophys Mol Biol. 2013. PMID: 24139944 Review.
-
Human tumour necrosis factor: physiological and pathological roles in placenta and endometrium.Placenta. 2009 Feb;30(2):111-23. doi: 10.1016/j.placenta.2008.10.012. Epub 2008 Nov 22. Placenta. 2009. PMID: 19027157 Free PMC article. Review.
Cited by
-
Altered death receptor signaling promotes epithelial-to-mesenchymal transition and acquired chemoresistance.Sci Rep. 2012;2:539. doi: 10.1038/srep00539. Epub 2012 Jul 27. Sci Rep. 2012. PMID: 22844580 Free PMC article.
-
Obesity and airway responsiveness: role of TNFR2.Pulm Pharmacol Ther. 2013 Aug;26(4):444-54. doi: 10.1016/j.pupt.2012.05.001. Epub 2012 May 11. Pulm Pharmacol Ther. 2013. PMID: 22584291 Free PMC article.
-
Chemotherapy: a double-edged sword in cancer treatment.Cancer Immunol Immunother. 2022 Mar;71(3):507-526. doi: 10.1007/s00262-021-03013-3. Epub 2021 Aug 5. Cancer Immunol Immunother. 2022. PMID: 34355266 Free PMC article. Review.
-
TNFα contributes to diabetes impaired angiogenesis in fracture healing.Bone. 2017 Jun;99:26-38. doi: 10.1016/j.bone.2017.02.014. Epub 2017 Mar 8. Bone. 2017. PMID: 28285015 Free PMC article.
-
Novel endogenous angiogenesis inhibitors and their therapeutic potential.Acta Pharmacol Sin. 2015 Oct;36(10):1177-90. doi: 10.1038/aps.2015.73. Epub 2015 Sep 14. Acta Pharmacol Sin. 2015. PMID: 26364800 Free PMC article. Review.
References
-
- Bais C, Wu X, Yao J, Yang S, Crawford Y, McCutcheon K, Tan C, Kolumam G, Vernes JM, Eastham-Anderson J, Haughney P, Kowanetz M, Hagenbeek T, Kasman I, Reslan HB, Ross J, Van Bruggen N, Carano RA, Meng YJ, Hongo JA, Stephan JP, Shibuya M, Ferrara N. Cell. 2010;141:166–77. - PubMed
-
- Barbara JA, Van ostade X, Lopez A. Immunol Cell Biol. 1996;74:434–43. - PubMed
-
- Bhardwaj A, Aggarwal BB. J Clin Immunol. 2003;23:317–32. - PubMed
Publication types
MeSH terms
Substances
Grants and funding
LinkOut - more resources
Full Text Sources
Other Literature Sources
Research Materials
