. 2012 Mar;5(3):492-497.
doi: 10.1158/1940-6207.CAPR-11-0370. Epub 2011 Dec 12.

Blood cell origin of circulating microRNAs: a cautionary note for cancer biomarker studies

Affiliations

Blood cell origin of circulating microRNAs: a cautionary note for cancer biomarker studies

Colin C Pritchard et al. Cancer Prev Res (Phila). 2012 Mar.

Abstract

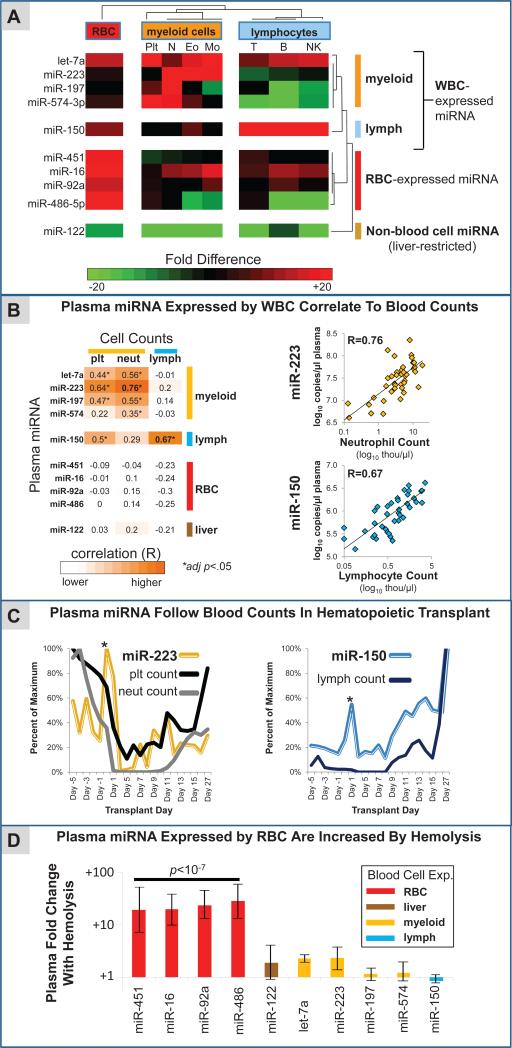
Circulating, cell-free microRNAs (miRNAs) hold great promise as a new class of cancer biomarkers due to their surprisingly high stability in plasma, association with disease states, and ease of sensitive measurement. Yet little is known about the origin of circulating miRNAs in either healthy or sick people or what factors influence levels of circulating miRNA biomarkers. Of 79 solid tumor circulating miRNA biomarkers reported in the literature, we found that 58% (46 of 79) are highly expressed in one or more blood cell type. Plasma levels of miRNA biomarkers expressed by myeloid (e.g., miR-223, miR-197, miR-574-3p, and let-7a) and lymphoid (e.g., miR-150) blood cells tightly correlated with corresponding white blood cell counts. Plasma miRNA biomarkers expressed by red blood cells (e.g., miR-486-5p, miR-451, miR-92a, and miR-16) could not be correlated to red cell counts due to limited variation in hematocrit in the cohort studied but were significantly increased in hemolyzed specimens (20- to 30-fold plasma increase; P < 0.0000001). Finally, in a patient undergoing autologous hematopoietic cell transplantation, plasma levels of myeloid- and lymphoid-expressed miRNAs (miR-223 and miR-150, respectively) tracked closely with changes in corresponding blood counts. We present evidence that blood cells are a major contributor to circulating miRNA and that perturbations in blood cell counts and hemolysis can alter plasma miRNA biomarker levels by up to 50-fold. Given that a majority of reported circulating miRNA cancer biomarkers are highly expressed in blood cells, we suggest caution in interpretation of such results as they may reflect a blood cell-based phenomenon rather than a cancer-specific origin.


Figures

Figure 1
Figure 1. Relationship between blood cell and plasma microRNA expression among published circulating cancer biomarkers
(Left) The Venn diagram depicts the distribution of 79 miRNAs published as biomarkers of nonhematopoietic cancers in healthy donor plasma and matched blood cells. “Plasma high” (yellow circle) refers to expression above the 50th percentile among 292 reliably detectable miRNAs by qPCR; “Plasma low” (green circle) refers to miRNAs detected below the 50th percentile, or not detected. “Blood cell high” (red circle) refers to miRNAs detected in the top 50th percentile in whole blood and at least one blood cell class as described in detail in the supplemental methods. (Right) A heat map showing side-by-side comparisons of plasma and blood cell expression of the 79 reported biomarkers demonstrates the close correlation between plasma and blood cell miRNA expression. P1 and P2 represent two independent plasma specimens drawn on different days. For blood cells, the columns represent multiple replicates and/or cell types as detailed in the methods. Circulating miRNA biomarkers are sorted in descending order of expression in healthy donor plasma and are not clustered.
Figure 2
Figure 2. Circulating microRNA biomarkers are influenced by blood cell counts and hemolysis
(A) A heatmap depicts the relative expression in blood cells of the 10 selected plasma miRNAs, 8 of which are published circulating miRNA cancer biomarkers. Let-7a, miR-223, miR-197, and miR-574-3p had the highest expression in myeloid blood cells (plt= platelets, N= neutrophils, Eo= eosinophils, Mo= monocytes). miR-150 was most abundant in lymphocytes (T= T-cells, B= B-cells, NK= natural killer cells), while miR-451, miR-16, miR-92a, and miR-486-5p were enriched in RBC. A liver-specific miRNA selected as a negative control (miR-122) was not appreciably expressed in any of the blood cells. Blood cell expression levels were determined using Exiqon v1 qRT-PCR arrays and confirmed in independent samples with Taqman qRT-PCR assays as described in the supplemental methods. (B) (Left) Results of plasma miRNA correlation to blood cell counts in 42 consecutive plasma samples from an academic hospital clinical laboratory are shown. Blood cell expression levels of the 10 miRNAs were inferred based on qRT-PCR Ct values as described in the supplemental methods. Pearson correlation coefficients of plasma miRNA levels and blood cell counts in the 42 clinical samples are shown in the table. Statistically significant correlations after correcting for multiple comparisons (i.e., adjusted p-value < 0.05) are highlighted by black boxes. (Right) Data corresponding to correlations for miR-223 with neutrophil count and miR-150 with lymphocyte count are plotted. (C) In a patient undergoing myeloablative chemotherapy and autologous hematopoietic stem cell transplant, plasma miR-223 tracked with changes in myeloid blood counts (neutrophils and platelets), and plasma miR-150 correlated with changes in lymphocyte counts. Notably, spikes in plasma miR-223 and miR-150 were observed following infusion of hematopoietic stem cells (asterisks). (D) Shown are the differences in mean expression of plasma miRNAs in hemolyzed specimens (n=3) compared to non-hemolyzed specimens (n=39). Error bars represent the standard error of the difference of means. The biomarkers that were most highly expressed in RBC (miR-451, miR-16, miR-92a, miR-486-5p) were 20 to 30-fold higher in hemolyzed specimens, which was highly statistically significant (p<10−7, two-tailed t-test).

References

    1. Mitchell PS, Parkin RK, Kroh EM, Fritz BR, Wyman SK, Pogosova-Agadjanyan EL, et al. Circulating microRNAs as stable blood-based markers for cancer detection. Proc Natl Acad Sci U S A. 2008;105:10513–8. - PMC - PubMed
    1. Chim SS, Shing TK, Hung EC, Leung TY, Lau TK, Chiu RW, et al. Detection and characterization of placental microRNAs in maternal plasma. Clin Chem. 2008;54:482–90. - PubMed
    1. Lawrie CH, Gal S, Dunlop HM, Pushkaran B, Liggins AP, Pulford K, et al. Detection of elevated levels of tumour-associated microRNAs in serum of patients with diffuse large B-cell lymphoma. Br J Haematol. 2008;141:672–5. - PubMed
    1. Chen X, Ba Y, Ma L, Cai X, Yin Y, Wang K, et al. Characterization of microRNAs in serum: a novel class of biomarkers for diagnosis of cancer and other diseases. Cell Res. 2008;18:997–1006. - PubMed
    1. Kosaka N, Iguchi H, Ochiya T. Circulating microRNA in body fluid: a new potential biomarker for cancer diagnosis and prognosis. Cancer Sci. 2010;101:2087–92. - PMC - PubMed