

High-throughput isotopic analysis of RNA microarrays to quantify microbial resource use
- PMID: 22158395
- PMCID: PMC3358021
- DOI: 10.1038/ismej.2011.175
High-throughput isotopic analysis of RNA microarrays to quantify microbial resource use
Abstract
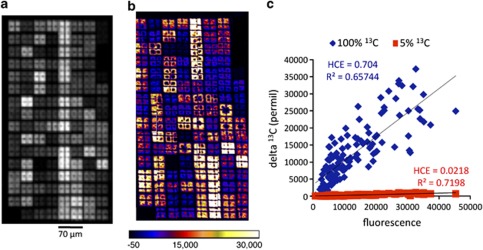
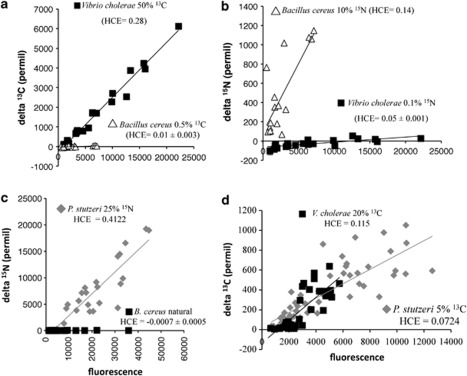
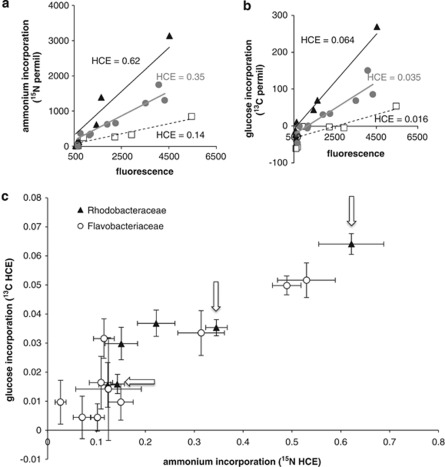
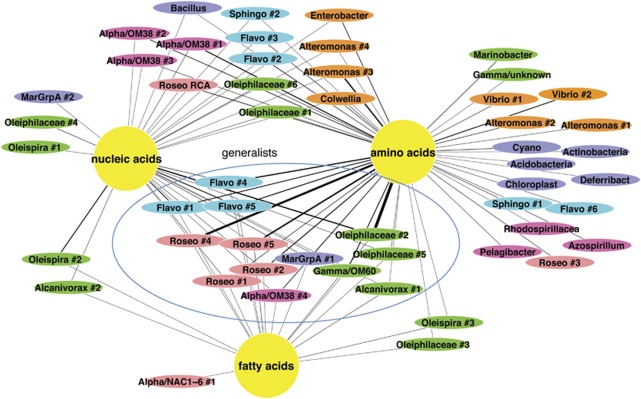
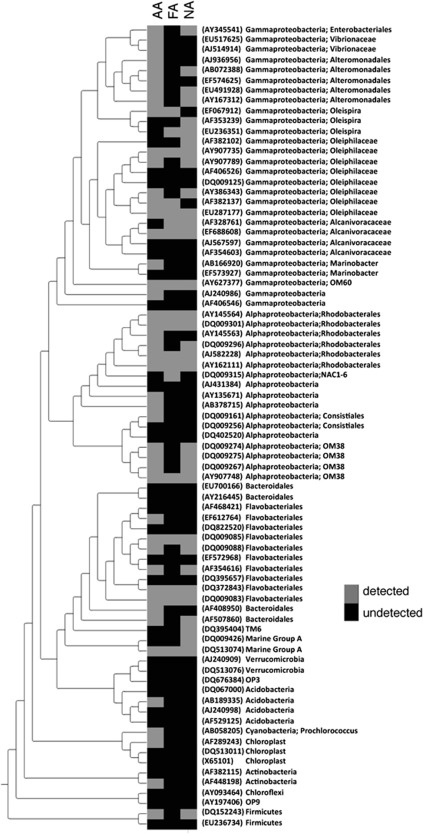
Most microorganisms remain uncultivated, and typically their ecological roles must be inferred from diversity and genomic studies. To directly measure functional roles of uncultivated microbes, we developed Chip-stable isotope probing (SIP), a high-sensitivity, high-throughput SIP method performed on a phylogenetic microarray (chip). This approach consists of microbial community incubations with isotopically labeled substrates, hybridization of the extracted community rRNA to a microarray and measurement of isotope incorporation--and therefore substrate use--by secondary ion mass spectrometer imaging (NanoSIMS). Laboratory experiments demonstrated that Chip-SIP can detect isotopic enrichment of 0.5 atom % (13)C and 0.1 atom % (15)N, thus permitting experiments with short incubation times and low substrate concentrations. We applied Chip-SIP analysis to a natural estuarine community and quantified amino acid, nucleic acid or fatty acid incorporation by 81 distinct microbial taxa, thus demonstrating that resource partitioning occurs with relatively simple organic substrates. The Chip-SIP approach expands the repertoire of stable isotope-enabled methods available to microbial ecologists and provides a means to test genomics-generated hypotheses about biogeochemical function in any natural environment.
Figures
References
-
- Ammerman JW, Azam F. Bacterial 5-nucleotidase in aquatic ecosystems: a novel mechanism of phosphorus regeneration. Science. 1985;227:1338–1340. - PubMed
-
- Behrens S, Losekann T, Pett-Ridge J, Weber PK, Ng W, Stevenson BS, et al. Linking microbial phylogeny to metabolic activity at the single-cell level by using enhanced element labeling-catalyzed reporter deposition fluorescence in situ hybridization (EL-FISH) and NanoSIMS. Appl Environ Microbiol. 2008;74:3143. - PMC - PubMed
-
- Beja O, Spudich EN, Spudich JL, Leclerc M, DeLong EF. Proteorhodopsin phototrophy in the ocean. Nature. 2001;411:786–789. - PubMed
-
- Boschker HTS, Nold SC, Wellsbury P, Bos D, de Graaf W, Pel R, et al. Direct linking of microbial populations to specific biogeochemical processes by 13C-labelling of biomarkers. Nature. 1998;392:801–805.
Publication types
MeSH terms
Substances
LinkOut - more resources
Full Text Sources
Molecular Biology Databases
Miscellaneous
