. 2011 Dec;23(12):4298-317.
doi: 10.1105/tpc.111.089482. Epub 2011 Dec 9.

The RPT2 subunit of the 26S proteasome directs complex assembly, histone dynamics, and gametophyte and sporophyte development in Arabidopsis

Affiliations

The RPT2 subunit of the 26S proteasome directs complex assembly, histone dynamics, and gametophyte and sporophyte development in Arabidopsis

Kwang-Hee Lee et al. Plant Cell. 2011 Dec.

Erratum in

Abstract

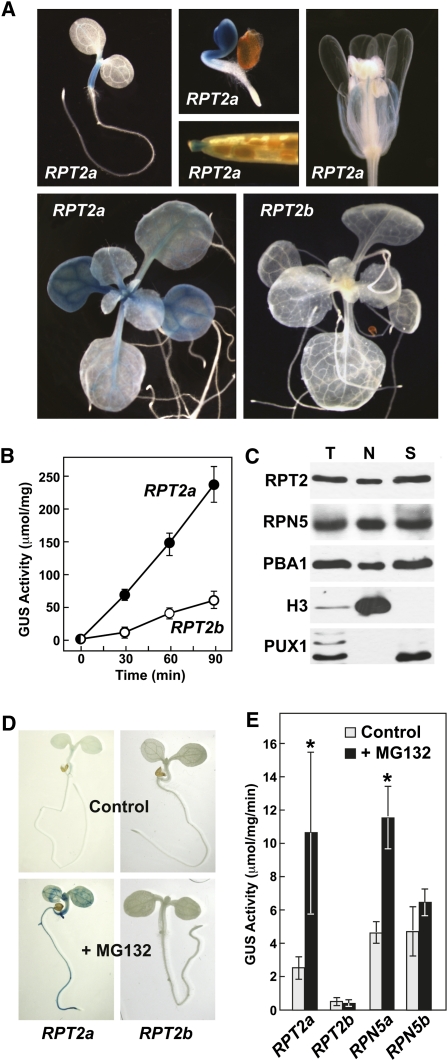
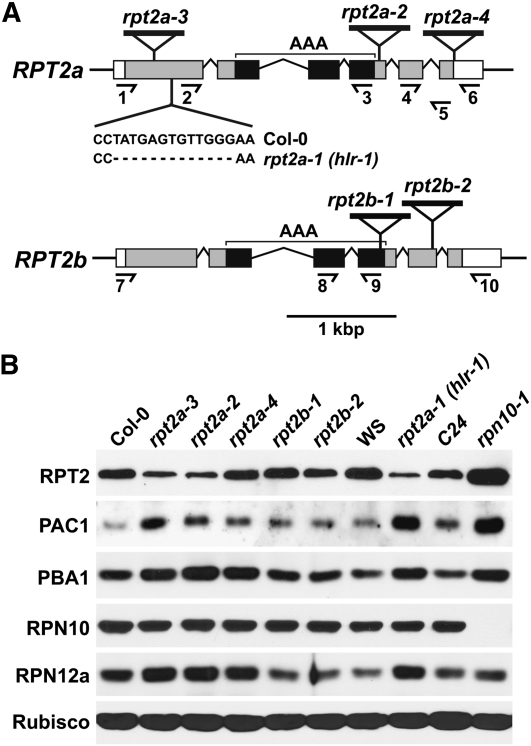
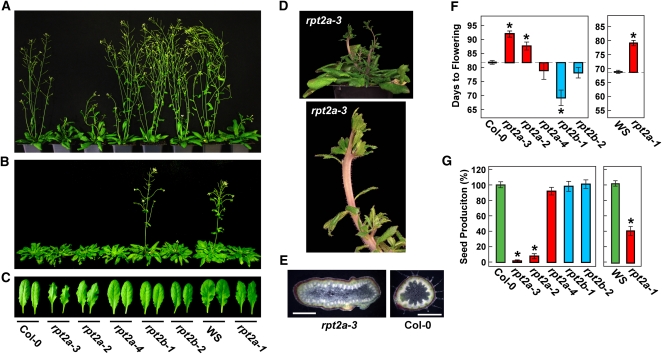
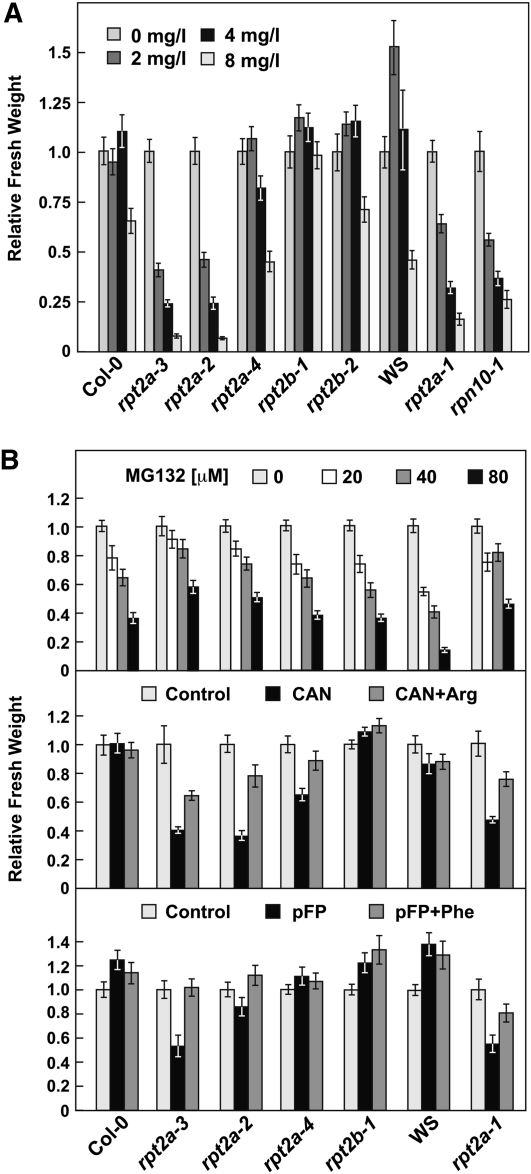
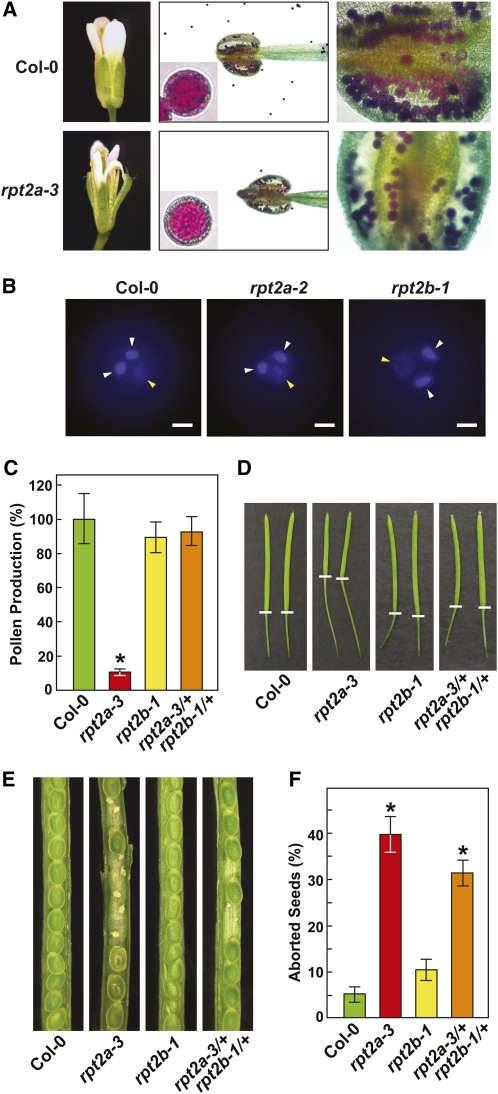
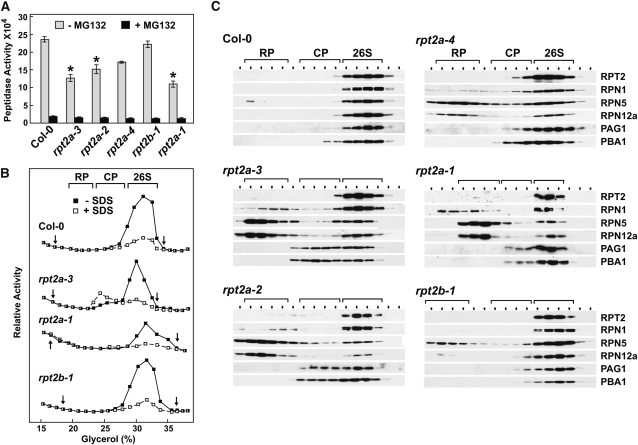
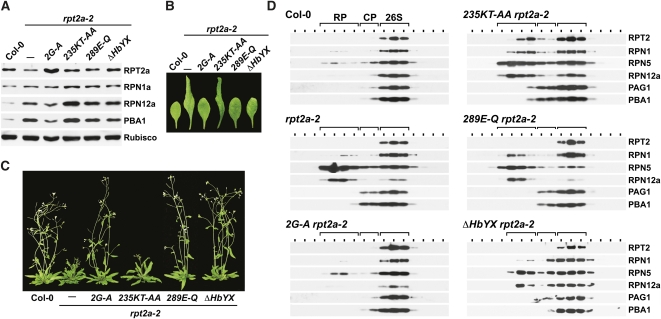
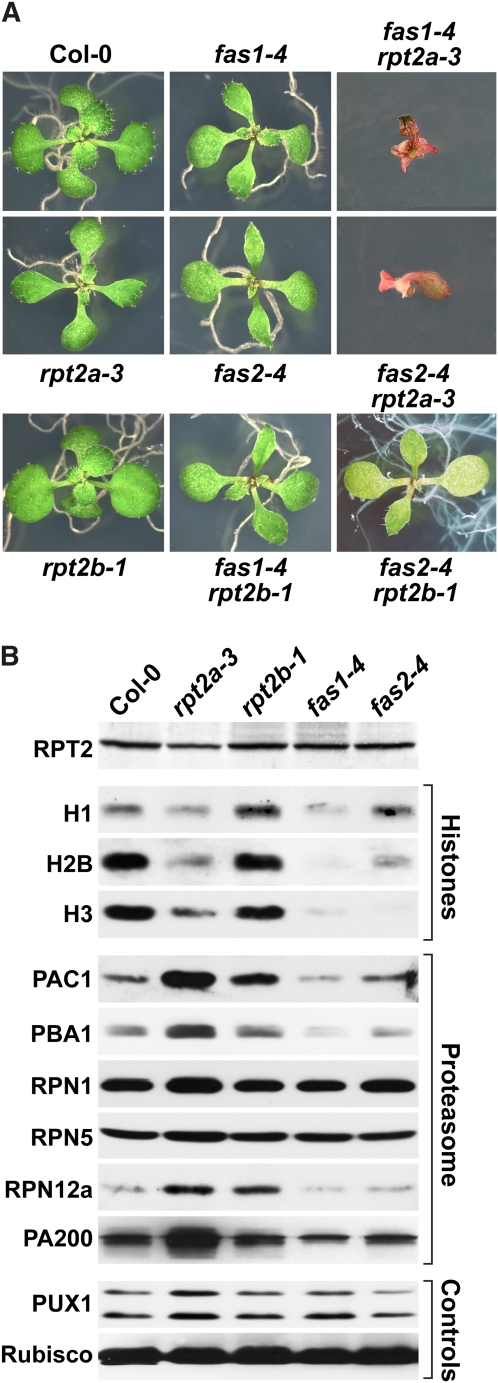
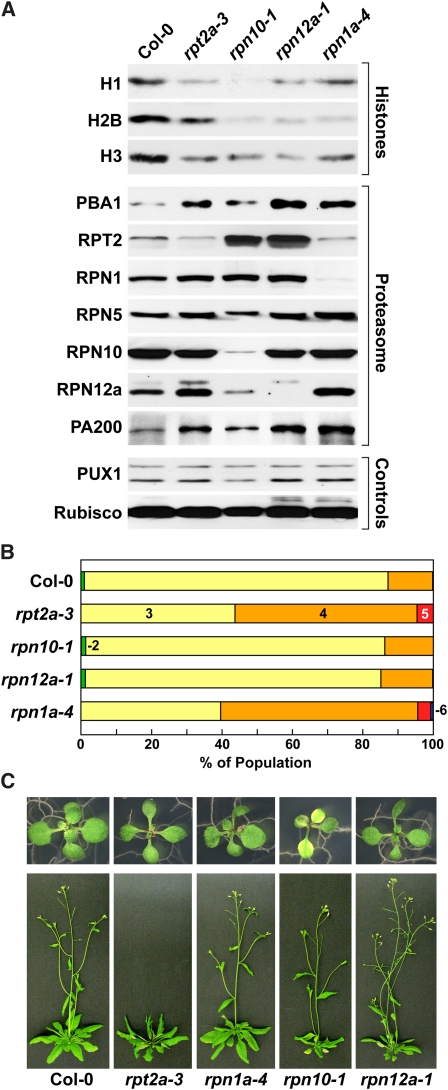
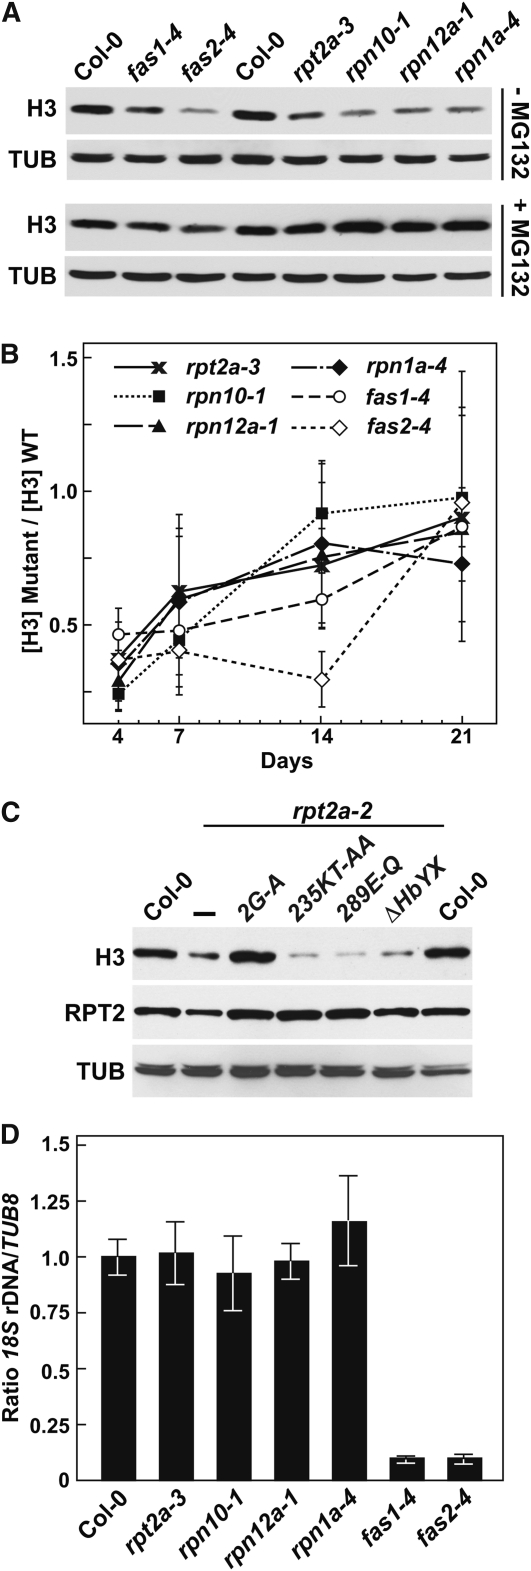
The regulatory particle (RP) of the 26S proteasome contains a heterohexameric ring of AAA-ATPases (RPT1-6) that unfolds and inserts substrates into the core protease (CP) for degradation. Through genetic analysis of the Arabidopsis thaliana gene pair encoding RPT2, we show that this subunit plays a critical role in 26S proteasome assembly, histone dynamics, and plant development. rpt2a rpt2b double null mutants are blocked in both male and female gamete transmission, demonstrating that the subunit is essential. Whereas rpt2b mutants are phenotypically normal, rpt2a mutants display a range of defects, including impaired leaf, root, trichome, and pollen development, delayed flowering, stem fasciation, hypersensitivity to mitomycin C and amino acid analogs, hyposensitivity to the proteasome inhibitor MG132, and decreased 26S complex stability. The rpt2a phenotype can be rescued by both RPT2a and RPT2b, indicative of functional redundancy, but not by RPT2a mutants altered in ATP binding/hydrolysis or missing the C-terminal hydrophobic sequence that docks the RPT ring onto the CP. Many rpt2a phenotypes are shared with mutants lacking the chromatin assembly factor complex CAF1. Like caf1 mutants, plants missing RPT2a or reduced in other RP subunits contain less histones, thus implicating RPT2 specifically, and the 26S proteasome generally, in plant nucleosome assembly.


Figures

Figure 1.
Figure 1.
Expression Patterns and Subcellular Localization of Arabidopsis RPT2a and RPT2b Genes and Proteins. (A) Expression patterns of RPT2apro:GUS and RPT2bpro:GUS fusions in various tissues. Examples include 1-week-old and 3-d-old seedlings for RPT2a, 2-week-old seedlings for RPT2a and b, and a developing silique and flower from RPT2a. (B) Quantitative expression of RPT2apro:GUS and RPT2bpro:GUS. GUS activities were determined by MUG assays of crude extracts obtained from 10-d-old seedlings. Shown is a time course of the MUG reaction generated with each transgenic line. Average activity (±se) was determined from the analysis of 30 independent lines each assayed in triplicate. (C) Localization of RPT2 protein in the cytosol and nucleus. Fourteen-day-old wild-type seedlings were homogenized and the total extract (T) was fractionated into the nuclear (N) and soluble fractions (S) by Percoll gradient centrifugation. Fractions were subjected to immunoblot analysis with antibodies against 26S proteasome subunits (RPT2, RPN5, and PBA1) and the nuclear and cytosolic markers histone H3 and PUX1, respectively. (D) Effect of the proteasome inhibitor MG132 on RPT2a and RPT2b expression. Four-day-old RPT2apro:GUS and RPT2bpro:GUS seedlings were treated for 36 h with 100 μM MG132 or an equivalent amount of DMSO (control) and then stained overnight with X-Gluc. (E) Quantitation of GUS activity generated upon treatment of 4-d-old RPT2apro:GUS and RPT2bpro:GUS seedlings with 100 μM MG132. Average levels of GUS were determined by MUG assay of three independent lines assayed in triplicate (±sd). The asterisks indicate a significant difference between control and MG132-treated samples (Student’s t test, P < 0.05). The RPT5apro:GUS and RPT5bpro:GUS lines used for comparison were as previously described (Book et al., 2009).
Figure 2.
Figure 2.
Description of Mutants in the RPT2a and RPT2b Genes. (A) Organization of the RPT2a and RPT2b genes highlighting the positions of the T-DNA insertion mutants and the rpt2a-1 (hlr-1) nucleotide deletion. Introns are indicated by lines. The coding region and untranslated regions are shown in black/gray and white boxes, respectively. The AAA-ATPase casette (AAA) is in black. The half arrows locate the positions of primers used for RT-PCR in Supplemental Figure 4A online. The nucleotide sequence deleted in the rpt2a-1 (hlr-1) mutant is shown compared with that for wild-type RPT2a. (B) Immunoblot detection of RPT2 and other 26S proteasome subunits in homozygous rpt2a and rpt2b mutants compared with their corresponding wild types: Col-0 for rpt2a-2, rpt2a-3, rpt2a-4, rpt2b-1, and rpt2b-2; Ws for rpt2a-1 (hlr-1); and C24 for rpn10-1. Equal protein loading was confirmed by probing the blots with anti-Rubisco antibodies.
Figure 3.
Figure 3.
Phenotypic Analysis of rpt2a and rpt2b Mutants. (A) rpt2a mutants have delayed flowering in LDs; 42-d-old plants are shown. (B) rpt2b mutants display accelerated flowering in SDs; 80-d-old plants are shown. (C) Abnormal rosette leaf morphology of rpt2a seedlings grown under SDs. Newly expanded leaves from 75-d-old plants grown in SDs are shown. (D) rpt2a-3 plants grown under SDs develop fasciated inflorescence stems. (E) Cross section of a fasciated stem from rpt2a-3 and wild-type Col-0 plants. Bars = 1 mm. (F) Effect of rpt2 mutations on flowering time under SDs. Each bar represents the average number of days before emergence of the inflorescence stem from 16 plants (±se). (G) Effect of rpt2a mutations on seed production. Bars show the relative number of seeds from 20 plants (±se) compared with those from the corresponding wild types. In both (F) and (G), the asterisks represent a significant difference between the wild type and mutants (analysis of variance [ANOVA] followed by Tukey’s multiple comparisons post-test, P < 0.05).
Figure 4.
Figure 4.
Sensitivity of rpt2a Mutants to Mitomycin C, MG132, and Amino Acid Analogs. (A) Sensitivity of rpt2 plants to mitomycin C. The relative fresh weight of at least 10 untreated versus treated plants (±se) was measured after 21 d. (B) Sensitivity of rpt2a plants to various concentrations of MG132, 5 μM canavanine (CAN), or 5 μM p-fluorophenylalanine (pFP). For CAN and pFP, a set of plants was also exposed to the analog plus 25 μM of their respective normal amino acid, Arg and Phe. Relative fresh weight of at least 10 untreated versus treated plants (±se) was measured after 21 d.
Figure 5.
Figure 5.
Characterization of Reproductive Organs from rpt2a-3 and rpt2b-1 Plants. (A) Abnormal floral development and pollen production for rpt2a-3 plants. Left panels, mature flowers. Middle panels, Alexander dye staining of individual pollen grains and anthers from young flowers. Right panels, close-up pictures of the anthers stained with Alexander’s dye. (B) The 4′,6-diamidino-2-phenylindole staining of mature pollen. The tube and sperm nuclei are indicated by the yellow and white arrowheads, respectively. Bar = 5 μm. (C) Quantification of pollen production from homozygous rpt2a-3 and rpt2b-1 flowers and double heterozygous rpt2a-3/+ rpt2b-1/+ flowers. Each bar shows the average number of pollen grains from 10 plants assayed in triplicate (±se) compared with that from wild-type Col-0. (D) Decreased silique elongation but increased pedicel elongation of rpt2a-3 plants. White bar marks the junction between the silique and pedicel. (E) Homozygous mutants affecting RPT2a substantially increase seed abortion. Pictured are siliques from self-fertilized wild-type Col-0, homozygous rpt2a-3 and rpt2b-1, and heterozygous rpt2a-3/+ rpt2b-1/+ flowers. (F) Quantification of seed abortion in self-fertilized homozygous rpt2a-3 flowers. Each bar (±se) represents the average percentage of aborted seeds from 20 siliques collected from 20 plants grown in LDs. In both (C) and (F), the asterisks indicate a significant difference between Col-0 wild type and the mutants (ANOVA followed by Tukey’s multiple comparisons post-test, P < 0.01 and P < 0.05, respectively).
Figure 6.
Figure 6.
rpt2a Mutants Destabilize the Arabidopsis 26S Proteasome. 26S proteasomes were enriched from 10-d-old liquid-grown seedlings of the indicated genotypes and subjected to glycerol gradient fractionation. (A) Total 26S proteasome activity in crude extracts. Equal amounts of crude extracts (based on total protein) were assayed for CP peptidase activity (±MG132) using the substrate Suc-LLVY-AMC. Each bar represents the average of triplicate assays (±sd). The asterisks indicate a significant difference between peptidase activity in the Col-0 wild type and mutants in the absence of MG132 (ANOVA followed by Tukey’s multiple comparisons post-test, P < 0.01). (B) Profile of CP peptidase activity across the glycerol gradient. Activity was measured in the absence or presence of 0.02% SDS using the substrate Suc-LLVY-AMC. The activity scale for each profile was adjusted to generate a near-equal height for the peak activity. The arrows delineate the range of fractions that were used for the immunoblot analyses in (C). (C) Immunoblot analyses of glycerol gradient fractions with antibodies prepared against various RP (RPT2, RPN1, RPN5, and RPN12a) and CP (PAG1 and PBA1) subunits of the 26S proteasome. The locations of the 26S proteasome and the CP and RP subcomplexes, as determined by peptidase activity and immunoblot analysis, are indicated by the brackets.
Figure 7.
Figure 7.
Effects of Various Site-Directed Mutants on RPT2a Activity. Heterozygous rpt2a-2 mutants were transformed with the mutant RPT2a transgenes expressed under the control of the RPT2a promoter and allowed to self, and then plants homozygous for the rpt2a-2 and transgene loci were identified by PCR (see Supplemental Figure 4C online). (A) Immunoblot analysis of transgenic rpt2a-2 plants stably expressing the 2G-A, 235KT-AA, 289E-Q, and ΔHbYX variants of RPT2a. Crude protein extracts were prepared from 10-d-old plants and subjected to immunoblot analysis with antibodies against RPT2a, RPN1a, RPN12a, and PBA1. Equal protein loading was confirmed by probing the blots with anti-Rubisco antibodies. (B) Phenotypic rescue of abnormal leaf shape. Newly expanded leaves from 7-week-old plants grown in LDs are shown. (C) Phenotypic rescue of inflorescence development. Seven-week-old plants homozygous for the rpt2a-2 mutation without or with the rescue transgenes are shown. (D) Integrity of the 26S proteasome in rpt2a-2 plants expressing various site-directed mutants of RPT2a. Crude extracts were separated by glycerol gradient centrifugation. The fractions were then subjected to immunoblot analysis with antibodies prepared against various RP (RPT2, RPN1, RPN5, and RPN12) and CP (PAG1 and PBA1) subunits of the 26S proteasome. The locations of the 26S proteasome and the CP and RP subcomplexes are indicated by the brackets.
Figure 8.
Figure 8.
rpt2a-3 and fas Mutants Have a Synergistic Effect on Arabidopsis Development and Have Reduced Histone Levels. (A) Phenotype of 2-week-old fas1-4 rpt2a-3 and fas2-4 rpt2a-3 double mutant seedlings compared with wild-type Col-0, rpt2a-3, fas1-4, and fas2-4 single and rpt2b-1 fas1-4 and rpt2b-1 fas2-4 double mutant seedlings grown on agar in continuous light. (B) Immunoblot analysis of the various fas and rpt2 mutants for histones (H1, H2B, and H3) and various subunits of the 26S proteasome. Crude protein extracts were prepared from 10-d-old plants and subjected to immunoblot analysis for the indicated proteins. Equal protein loading was confirmed by probing the blots with anti-PUX1 and anti-Rubisco antibodies.
Figure 9.
Figure 9.
RP Mutants Have Differential Effects on Histone Levels and Arabidopsis Development. (A) Immunoblot analysis of the various RP mutants for histones (H1, H2B, and H3) and various subunits of the 26S proteasome. Crude protein extracts were prepared from 10-d-old plants and subjected to immunoblot analysis for the indicated proteins. Equal protein loading was confirmed by probing the blots with anti-PUX1 and anti-Rubisco antibodies. (B) Quantification of trichome branching. Each data set from 2-week-old seedlings represents the percentages of the total trichome population with specific branch numbers: 2 (green), 3 (yellow), 4 (orange), 5 (red), and 6 (blue) branches. (C) Growth phenotypes of various RP mutants. Two- and five-week-old plants grown in LDs are shown.
Figure 10.
Figure 10.
RP and fas Mutants Have Differential Effects on Histone and 45S rDNA Levels. (A) Restoration of histone H3 levels by exposing rpn/rpt mutant seedlings to MG132. Plants were grown on GM liquid medium for 5 d before incubation with 100 μM MG132 for 36 h. Crude extracts were immunoblotted for histone H3. Equal protein loading was confirmed by probing the blots with an anti-α-tubulin (αTUB) antibody. (B) Recovery of histone H3 during seedling growth. Whole seedlings grown for 4, 7, 14, and 21 d were analyzed for the ratio of histone H3/α-tubulin (αTUB) as measured by immunoblot analysis of crude extracts. Each bar represents the average of triplicate assays (±sd). WT, wild type. (C) Ability of various site-directed mutants of RPT2a to restore histone H3 levels. Crude extracts from 7-d-old wild-type Col-0, rpt2a-2, and rpt2a-2 seedlings expressing the various RPT2a mutations were immunoblotted with antibodies against histone H3 and RPT2a and the α-tubulin (αTUB) control. Mutant lines are described in Figure 7. (D) Relative quantity of 45S rDNA evaluated by quantitative PCR in RP and fas mutants. Genomic DNAs were isolated from 4-d-old seedlings from 30 independent plants and subjected to quantitative PCR using 18S rDNA gene-specific primers (Mozgová et al., 2010). The signals were normalized by quantitative PCR with the TUB8 gene. Each bar indicates the average of triplicate assays (±sd).

Similar articles

Cited by

References

    1. Alexander M.P. (1969). Differential staining of aborted and nonaborted pollen. Stain Technol. 44: 117–122 - PubMed
    1. Alonso J.M., et al. (2003). Genome-wide insertional mutagenesis of Arabidopsis thaliana. Science 301: 653–657 - PubMed
    1. Bohn S., Beck F., Sakata E., Walzthoeni T., Beck M., Aebersold R., Förster F., Baumeister W., Nickell S. (2010). Structure of the 26S proteasome from Schizosaccharomyces pombe at subnanometer resolution. Proc. Natl. Acad. Sci. USA 107: 20992–20997 - PMC - PubMed
    1. Boisson B., Giglione C., Meinnel T. (2003). Unexpected protein families including cell defense components feature in the N-myristoylome of a higher eukaryote. J. Biol. Chem. 278: 43418–43429 - PubMed
    1. Book A.J., Gladman N.P., Lee S.S., Scalf M., Smith L.M., Vierstra R.D. (2010). Affinity purification of the Arabidopsis 26S proteasome reveals a diverse array of plant proteolytic complexes. J. Biol. Chem. 285: 25554–25569 - PMC - PubMed

Publication types

MeSH terms