. 2011 Dec 11;15(1):113-22.
doi: 10.1038/nn.2993.

Coactivation of thalamic and cortical pathways induces input timing-dependent plasticity in amygdala

Affiliations

Coactivation of thalamic and cortical pathways induces input timing-dependent plasticity in amygdala

Jun-Hyeong Cho et al. Nat Neurosci. .

Abstract

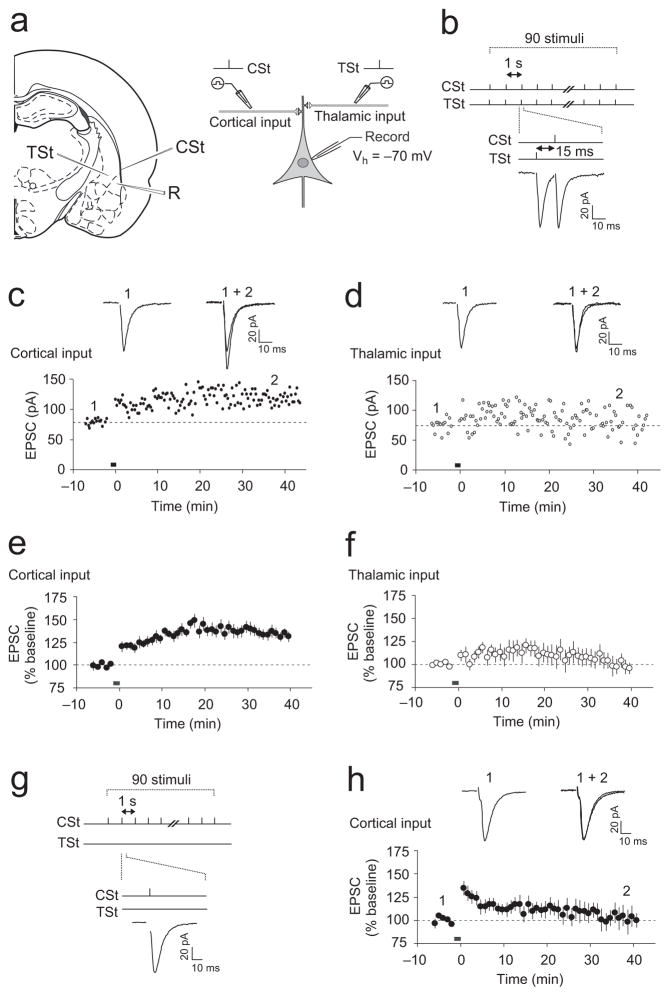
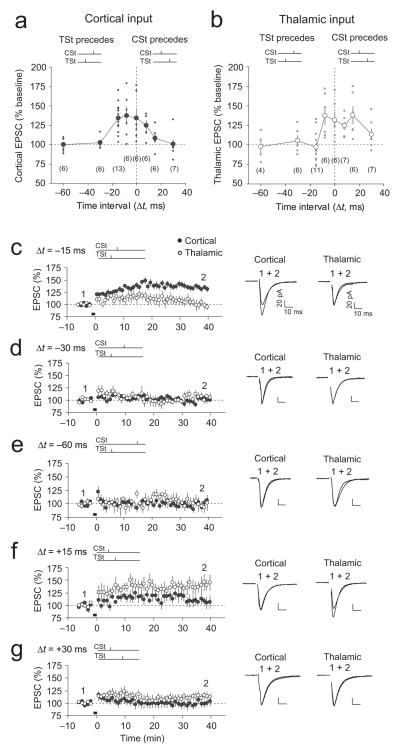
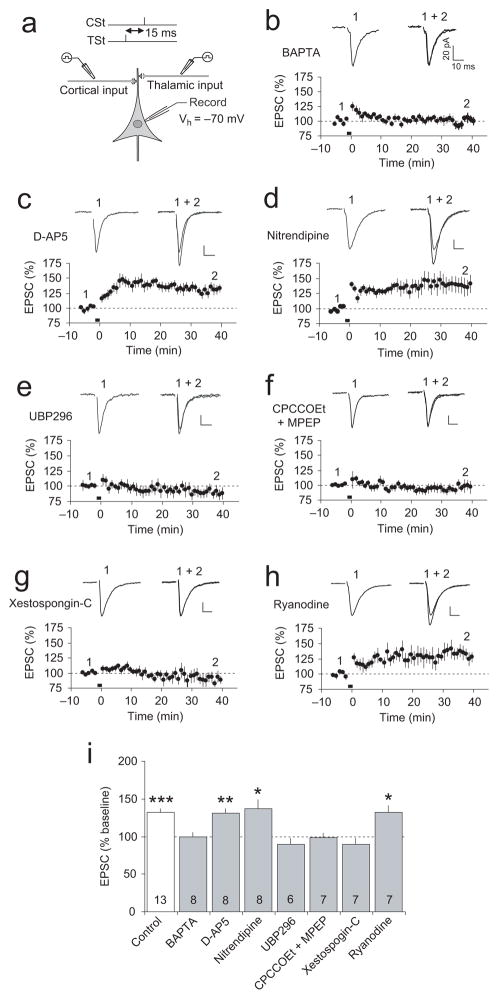
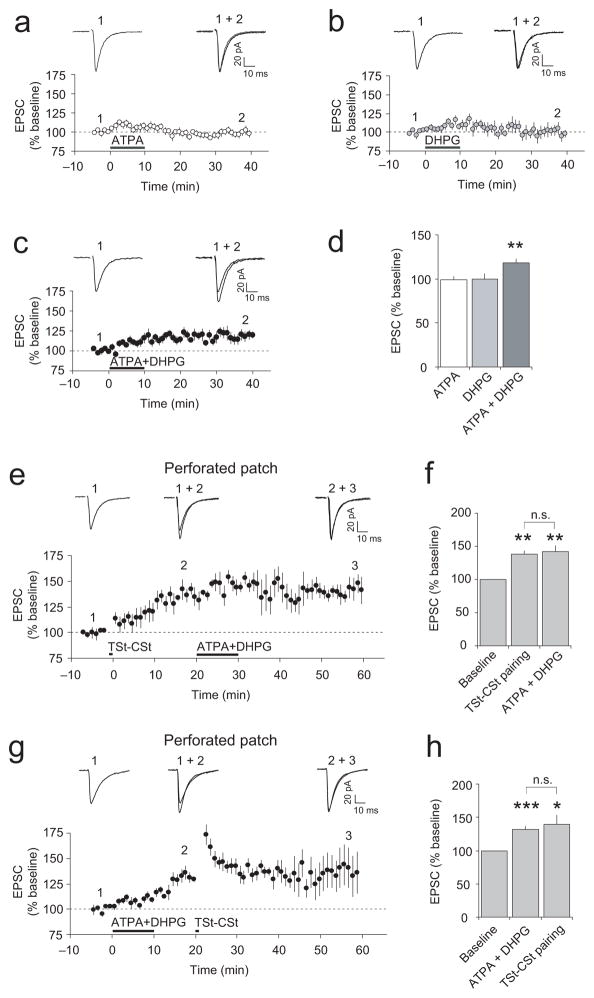
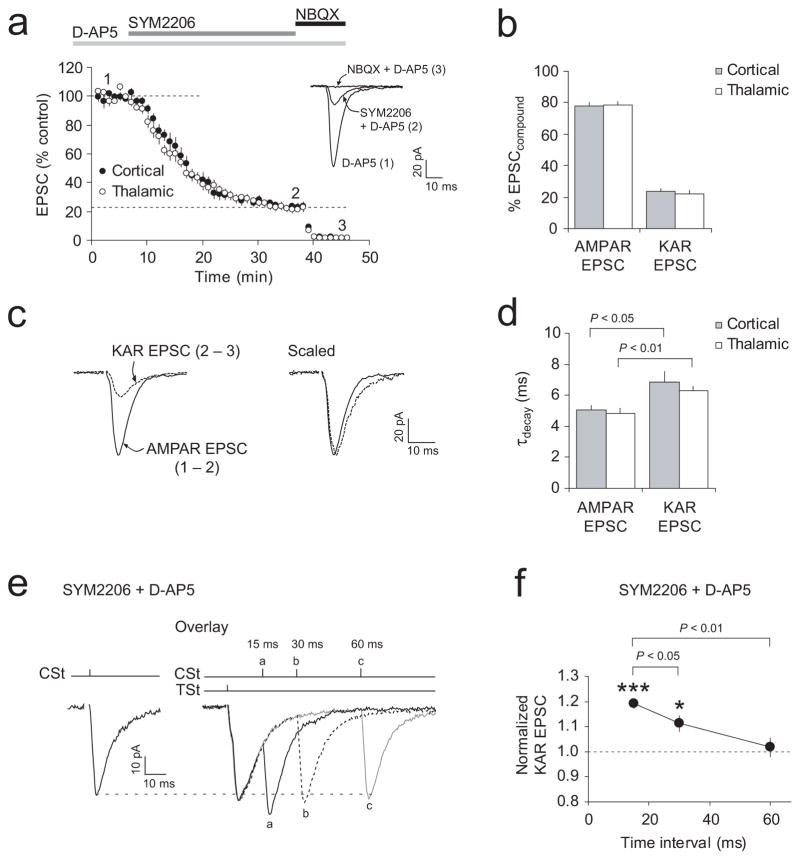
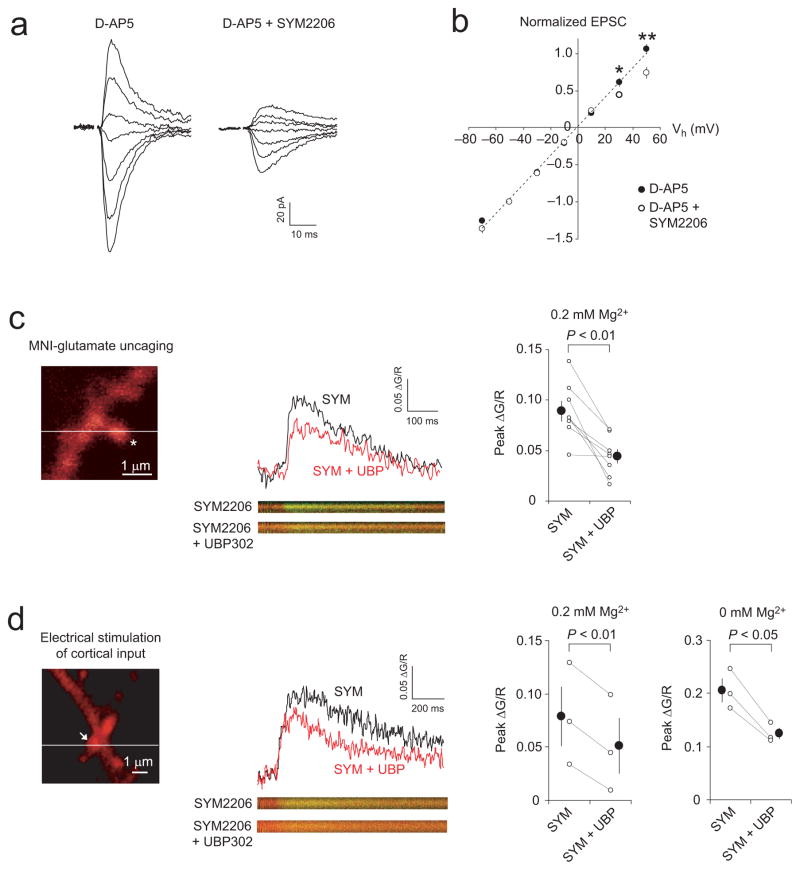
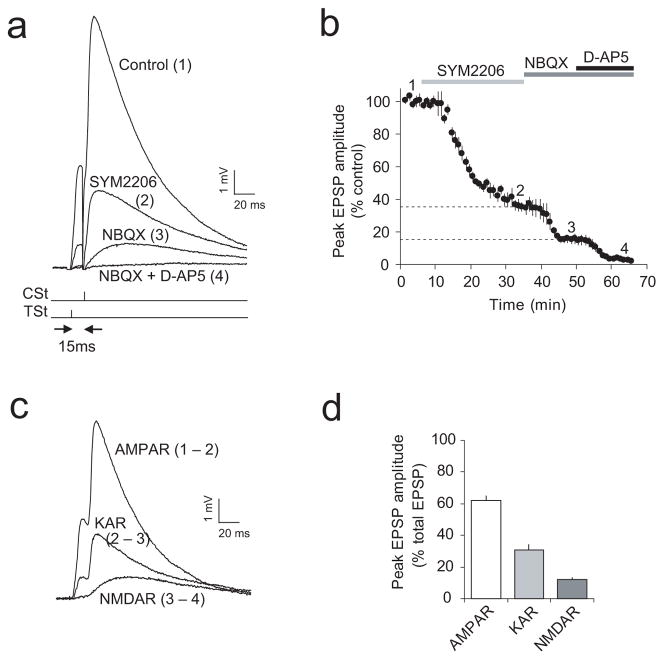
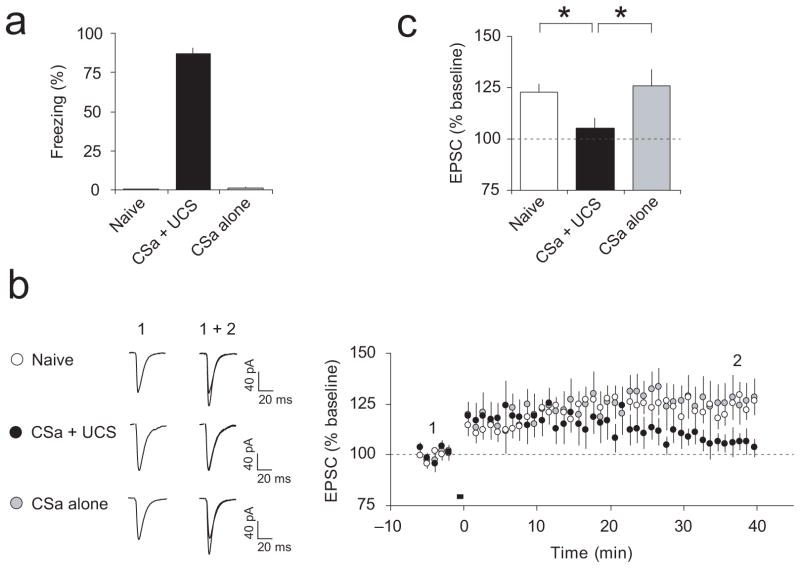
Long-term synaptic enhancements in cortical and thalamic auditory inputs to the lateral nucleus of the amygdala (LAn) mediate encoding of conditioned fear memory. It is not known, however, whether the convergent auditory conditioned stimulus (CSa) pathways interact with each other to produce changes in their synaptic function. We found that continuous paired stimulation of thalamic and cortical auditory inputs to the LAn with the interstimulus delay approximately mimicking a temporal pattern of their activation in behaving animals during auditory fear conditioning resulted in persistent potentiation of synaptic transmission in the cortico-amygdala pathway in rat brain slices. This form of input timing-dependent plasticity (ITDP) in cortical input depends on inositol 1,4,5-trisphosphate (InsP(3))-sensitive Ca(2+) release from internal stores and postsynaptic Ca(2+) influx through calcium-permeable kainate receptors during its induction. ITDP in the auditory projections to the LAn, determined by characteristics of presynaptic activity patterns, may contribute to the encoding of the complex CSa.


Figures

Figure 1
Figure 1
Paired stimulation of thalamic and cortical inputs induces ITDP at the cortico-LAn synapses. (a) Schematic representations of the slice preparation, showing positions of recording and stimulation electrodes (left), and the experimental design (right). Stimulation electrodes (CSt and TSt) were positioned to activate cortical or thalamic inputs, respectively. R, recording electrode. (b) A diagram illustrating the TSt-CSt protocol, consisting of paired stimulation of thalamic and cortical inputs. TSt was delivered 15 ms earlier than CSt. Below, examples of the EPSCs during the TSt-CSt stimulation. (c) TSt-CSt pairing-induced ITDP in cortical input to the LAn. Insets show the average of fifteen cortico-LAn EPSCs recorded before (1) and 35–40 min after (2) the TCt-CSt stimulation (black horizontal bar). Stimulation artifacts were removed for clarity in these and all other examples of EPSCs. (d) EPSCs in thalamic input in the same experiment as in (c). Insets show the average of fifteen thalamo-LAn EPSCs before (1) and after (2) the TSt-CSt stimulation. (e) Summary graph of all experiments as in (c) (n = 13, paired t test, P < 0.001 versus baseline). The magnitude of potentiation was determined at 35–40 min after the induction. (f) Summary graph of all experiments as in (d) (n = 11, P = 0.53 versus baseline). (g) Design of experiments where TSt was omitted. (h) Potentiation of cortico-LAn EPSCs was not observed if only cortical input was stimulated (black bar) (n = 6, P = 0.55 versus baseline). Error bars indicate s.e.m.
Figure 2
Figure 2
Dependence of ITDP induction on time interval between TSt and CSt. (a) Normalized amplitude (% baseline) of the cortico-LAn EPSC at 35–40 min after paired stimulation when either the TSt preceded the CSt (−Δt) or the CSt preceded the TSt (+Δt). Time intervals during TSt-CSt paring (in ms): 0, −8, −15, −30 and −60; during CSt-TSt paring: +8, +15 and +30. Data points represent individual experiments. The number of experiments is indicated in brackets. (b) Amplitude of the thalamo-LAn EPSC after paired stimulation (same experimental design as in (a)). (c) Summary graph demonstrating the time course of EPSC amplitude changes before and after TSt-CSt stimulation with Δt = −15 ms. Same data as in Fig. 1e,f were included here for a comparison with other Δt. Traces are averages of fifteen EPSCs recorded before (1) and after (2) the coactivation (black bar). (d) Same as in (c) but with Δt = −30 ms (n = 6, paired t test, P = 0.50 versus baseline in cortical input). (e) Same as in (c) and (d) but with Δt = −60 ms (n = 6, P = 0.94 versus baseline in cortical input). (f) Summary of experiments with Δt = +15 ms during the CSt-TSt paring (n = 6, P < 0.05 versus baseline in thalamic input, but P = 0.27 versus baseline in cortical input). (g) Same as in (f) but with Δt = +30 ms (n = 7). Scale bars: 20 pA, 10 ms. Error bars indicate s.e.m.
Figure 3
Figure 3
Requirements for the induction of ITDP. (a) Experimental design. (b) ITDP in cortical input was blocked by BAPTA (10 mM) in the recording pipette solution (n = 8, paired t test, P = 0.67 versus baseline). Insets show the average of fifteen cortico-LAn EPSCs before (1) and after (2) the TSt-CSt stimulation. Scale bars here and for other traces in the figure: 20 pA and 10 ms. (c) ITDP in cortical input in the presence of D-AP5 (50 μM, n = 8, P < 0.01 versus baseline). (d) ITDP in cortical input in the presence of nitrendipine (20 μM, n = 8, P < 0.05 versus baseline). (e) ITDP in cortical input was blocked in the presence of UBP 296 (5 μM, n = 6, P = 0.23 versus baseline). (f) Joint application of CPCCOEt (40 μM) and MPEP (20 μM) also blocked ITDP (n = 7, P = 0.61 versus baseline). (g) Xestospongin-C (10 μM) in pipette solution blocked the induction of ITDP (n = 7, P = 0.39 versus baseline). (h) Inclusion of ryanodine (100 μM) in pipette solution had no effect on ITDP (n = 7, P < 0.05 versus baseline). (i) Summary of ITDP experiments. Numbers within bars indicate the number of experiments for each condition. *P < 0.05, **P < 0.01, and ***P < 0.001, mean baseline EPSC amplitude versus EPSCs recorded 35–40 minutes after the TSt-CSt pairing, paired t test. Error bars indicate s.e.m.
Figure 4
Figure 4
Coactivation of GluR5-containing KARs and group I mGluRs during ITDP induction. (a and b) Application of ATPA (1 μM) or (S)-DHPG (10 μM) alone did not potentiate the cortico-LAn EPSCs (ATPA: n = 10, P = 0.76 versus baseline; (S)-DHPG: n = 6, P = 0.95; paired t test). Insets show averaged cortico-LAn EPSCs recorded before (1) and at the end (2) of ATPA or (S)-DHPG application. (c) Applied jointly, ATPA and (S)-DHPG induced potentiation of the EPSC in cortical input (n = 8). (d) Summary of the ATPA and (S)-DHPG effects on cortico-LAn EPSCs (**P < 0.01 versus baseline). (e) Perforated patch technique was used in these experiments. The induction of ITDP (TSt-CSt pairing, Δt = −15 ms) occluded potentiation of the EPSC by jointly-applied ATPA and (S)-DHPG (n = 5). (f) Summary of the experiments as in (e). Jointly-applied ATPA and (S)-DHPG did not produce additional potentiation in cortical input (n = 5, paired t test, P = 0.49 for ITDP magnitude versus potentiation with subsequently-added agonists, n.s.). **P < 0.01 for both ITDP magnitude and potentiation after addition of agonists versus the baseline. (g) The order of treatments was reversed. Coapplication of ATPA and (S)-DHPG preceded TSt-CSt stimulation (n = 7). (h) Summary of the experiments as in (g): ***P < 0.001 for agonist-induced potentiation and *P < 0.05 for the EPSC amplitude following TSt-CSt stimulation versus the baseline EPSC; no significant difference for agonist-induced potentiation versus ITDP magnitude, P = 0.55. Error bars indicate s.e.m.
Figure 5
Figure 5
Spatiotemporal summation of KAR-mediated EPSCs during TSt-CSt stimulation. (a) Effects of SYM 2206 (100 μM) and NBQX (10 μM) on the EPSC amplitude in cortical (n = 10) and thalamic (n = 9) inputs in the presence of D-AP5 (50μM). Inset shows the averages of fifteen traces under baseline conditions (1), during SYM 2206-induced depression (2), and after NBQX addition (3). (b) Fractional contribution of the AMPAR- and KAR-mediated current components. To isolate the KAR-mediated EPSC, EPSCNBQX (trace 3 in a) was subtracted from EPSCSYM2206 (trace 2). The AMPAR-mediated EPSC was isolated by subtracting EPSCSYM2206 (trace 2) from EPSCD-AP5 (trace 1). (c) Left, examples of isolated AMPAR- and KAR-mediated EPSCs. Right, same traces scaled by their peak amplitudes. (d) Decay time constants (from a single-exponential fit) of AMPAR-EPSCs and KAR-EPSCs in cortical (n = 8) and thalamic (n = 8) inputs. KAR-mediated EPSCs decayed significantly slower (P < 0.05 for cortical input, P < 0.01 for thalamic input, paired t test). (e) Left, KAR-mediated EPSC when cortical input was stimulated alone. Right, KAR-EPSCs when TSt preceded CSt by 15 ms (a), 30 ms (b), and 60 ms (c). (f) Spatiotemporal summation of KAR-mediated EPSCs depended on the time interval between TSt and CSt during paired stimulation. EPSCs were normalized to the EPSC evoked by CSt alone (n = 7, *P < 0.05 for 30-ms delay, and ***P < 0.001 for 15 ms-delay during the TSt-CSt pairing versus CSt alone; paired t test). Error bars indicate s.e.m.
Figure 6
Figure 6
KARs in dendritic spines of LAn neurons are Ca2+-permeable (a) EPSCs in cortical input at holding potentials from −70 mV to +50 mV in the presence of D-AP5 (50 μM) or D-AP5 + SYM 2206 (100 μM). (b) I-V plots of the cortico-LAn EPSCs (n = 8). The peak EPSC amplitude at each holding potential was normalized to the amplitude at −50 mV. The I-V plot became inwardly-rectifying when SYM 2206 was added (*P < 0.05, **P < 0.01; t test). (c) Left, the two-photon microscopic image of dendritic spine of LAn neuron. Asterisk, the position of uncaging laser pulse. Horizontal line, the position of line scans. Middle, Ca2+ transients were evoked by uncaging MNI-glutamate (2.5–5 mM) with single two-photon laser pulses in the presence of 0.2 mM Mg2+ and 100 μM SYM 2206. Ca2+ transients were quantified as the ratio of change in green (Ca2+-sensitive dye, Fluo-5F) to red (structural dye, Alexa 594) fluorescence (ΔG/R). The Ca2+ transient was reduced by UBP 302 (10 μM). Right, summary of the UBP 302 effects on Ca2+ transients (8 dendritic spines). (d) Left, dendritic spine (arrow) which was stimulated with electrical pulses delivered to cortical input in the presence of 0.2 mM Mg2+ and SYM 2206. Middle, UBP 302 reduced synaptically-induced Ca2+ transients in dendritic spine. Right, summary of UBP 302-induced changes in synaptically-induced Ca2+ transients when external solution contained either 0.2 mM Mg2+ (3 experiments) or 0 mM Mg2+ (3 experiments). Error bars indicate s.e.m.
Figure 7
Figure 7
Fractional contribution of the AMPAR-, KAR-, and NMDAR-mediated synaptic components to the compound EPSP during the TSt-CSt paired stimulation. (a) Examples of the EPSPs recorded in a LAn neuron in current-clamp mode evoked by paired stimulation of thalamic and cortical inputs with a 15 ms interval under control conditions (1) and in the presence of SYM 2206 (2), NBQX (3), and NBQX + D-AP5 (4). Reponses were evoked once every 20 s. Note significant spatiotemporal summation of EPSPs during the TSt-CSt paired stimulation. (b) Time course of the EPSP depression during application of SYM 2206, NBQX, and NBQX + D-AP5 (indicated by bars above the graph). Peak amplitude of EPSPs was normalized to the baseline EPSP amplitude (n = 6). (c) Examples of isolated (subtracted) AMPAR-, KAR-, and NMDAR-mediated EPSPs from an experiment shown in (a): EPSPAMPAR = EPSPcontrol − EPSPSYM2206; EPSPKAR = EPSPSYM2206 − EPSPNBQX; EPSPNMDAR = EPSPNBQX − EPSPNBQX+D-AP5. (d) Fractional contribution of the AMPAR-, KAR-, and NMDAR-EPSPs in the compound EPSP (based on the peak amplitude measurements) during paired TSt-CSt stimulation (n = 6). Error bars indicate s.e.m.
Figure 8
Figure 8
ITDP in cortico-LAn pathway is occluded in slices from fear-conditioned rats. (a) Freezing responses following single-trial auditory fear conditioning (CSa + UCS group) and freezing in behaviorally naïve rats and rats which received the CSa only. (b) Left, Representative cortico-LAn EPSCs (averages of 10 responses) recorded before (1) and after (2) the delivery of the TSt-CSt protocol (Δt = −15 ms) in slices from all experimental groups (naïve, CSa + UCS, and CSa alone). Right, ITDP at the cortico-LAn synapses was occluded in slices from fear-conditioned rats (n = 12 neurons from 8 rats, paired t test, P = 0.18 versus the baseline amplitude), while significant ITDP was observed in behaviorally naïve rats (n = 14 neurons from 9 rats, P < 0.001 versus baseline) or the “CSa alone” rats (n = 7 neurons from 4 rats, P < 0.05 versus baseline). (c) Summary of the EPSC amplitude changes in cortical input following the TSt-CSt paired stimulation (as in b) in slices from different experimental groups of rats. * P < 0.05, CSa + UCS group versus naïve or CSa alone group, one-way ANOVA with post hoc Bonferroni simultaneous tests. Error bars are s.e.m.

Similar articles

Cited by

References

    1. LeDoux JE. Emotion circuits in the brain. Annu Rev Neurosci. 2000;23:155–184. - PubMed
    1. Maren S, Quirk GJ. Neuronal signalling of fear memory. Nat Rev Neurosci. 2004;5:844–852. - PubMed
    1. Romanski LM, LeDoux JE. Equipotentiality of thalamo-amygdala and thalamo-cortico-amygdala circuits in auditory fear conditioning. J Neurosci. 1992;12:4501–4509. - PMC - PubMed
    1. Campeau S, Davis M. Involvement of subcortical and cortical afferents to the lateral nucleus of the amygdala in fear conditioning measured with fear-potentiated startle in rats trained concurrently with auditory and visual conditioned stimuli. J Neurosci. 1995;15:2312–2327. - PMC - PubMed
    1. Armony JL, Servan-Schreiber D, Romanski LM, Cohen JD, LeDoux JE. Stimulus generalization of fear responses: effects of auditory cortex lesions in a computational model and in rats. Cereb Cortex. 1997;7:157–165. - PubMed

Publication types

MeSH terms

Substances