Meta-Analysis
. 2011 Dec 11;44(1):67-72.
doi: 10.1038/ng.1019.

Meta-analysis of genome-wide association studies identifies eight new loci for type 2 diabetes in east Asians

Collaborators, Affiliations
Meta-Analysis

Meta-analysis of genome-wide association studies identifies eight new loci for type 2 diabetes in east Asians

Yoon Shin Cho et al. Nat Genet. .

Abstract

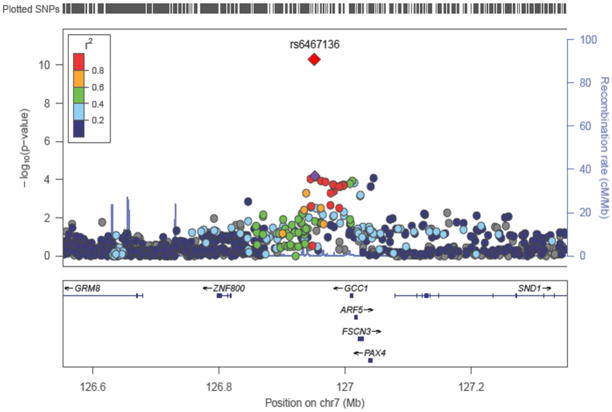
We conducted a three-stage genetic study to identify susceptibility loci for type 2 diabetes (T2D) in east Asian populations. We followed our stage 1 meta-analysis of eight T2D genome-wide association studies (6,952 cases with T2D and 11,865 controls) with a stage 2 in silico replication analysis (5,843 cases and 4,574 controls) and a stage 3 de novo replication analysis (12,284 cases and 13,172 controls). The combined analysis identified eight new T2D loci reaching genome-wide significance, which mapped in or near GLIS3, PEPD, FITM2-R3HDML-HNF4A, KCNK16, MAEA, GCC1-PAX4, PSMD6 and ZFAND3. GLIS3, which is involved in pancreatic beta cell development and insulin gene expression, is known for its association with fasting glucose levels. The evidence of an association with T2D for PEPD and HNF4A has been shown in previous studies. KCNK16 may regulate glucose-dependent insulin secretion in the pancreas. These findings, derived from an east Asian population, provide new perspectives on the etiology of T2D.


Figures

Figure 1
Figure 1. Genome-wide Manhattan plot for the EA T2D stage 1 meta-analysis
−log10(P-values) using the trend test are shown for SNPs distributed across the entire autosomal genome. Red dots at each locus indicate the signals with P-value <10−6 detected in the genome-wide meta-analysis. A total of 1,934,619 SNPs that were present in ≥5 stage 1 studies were used to generate both plots.
Figure 2
Figure 2. Regional association plots for new T2D loci
The upper panel indicates the positions of SNPs and the middle panel, shows regional association results from the genome-wide meta-analysis. The trend test −log10(P-values) are shown for SNPs distributed in a 0.8 Mb genomic region centered on the most strongly associated signal, which is depicted as a purple diamond in the stage 1 results and a red diamond for the combined stage 1+2+3 results. The lower panel shows the locations of known genes in the region. Genetic information is taken from Human Genome build hg18 and LD structure was based on 1000 Genomes (June 2010) HapMap JPT+CHB.

References

    1. Kang HS, et al. Transcription factor Glis3, a novel critical player in the regulation of pancreatic beta-cell development and insulin gene expression. Mol Cell Biol. 2009;29:6366–79. - PMC - PubMed
    1. Yang Y, Chang BH, Samson SL, Li MV, Chan L. The Kruppel-like zinc finger protein Glis3 directly and indirectly activates insulin gene transcription. Nucleic Acids Res. 2009;37:2529–38. - PMC - PubMed
    1. Dupuis J, et al. New genetic loci implicated in fasting glucose homeostasis and their impact on type 2 diabetes risk. Nat Genet. 2010;42:105–16. - PMC - PubMed
    1. Barker A, et al. Association of genetic Loci with glucose levels in childhood and adolescence: a meta-analysis of over 6,000 children. Diabetes. 2011;60:1805–12. - PMC - PubMed
    1. Takeuchi F, et al. Confirmation of multiple risk Loci and genetic impacts by a genome-wide association study of type 2 diabetes in the Japanese population. Diabetes. 2009;58:1690–9. - PMC - PubMed

Publication types

Grants and funding