

Cortical high-gamma responses in auditory processing
- PMID: 22158634
- PMCID: PMC3848128
- DOI: 10.1044/1059-0889(2011/10-0036)
Cortical high-gamma responses in auditory processing
Abstract
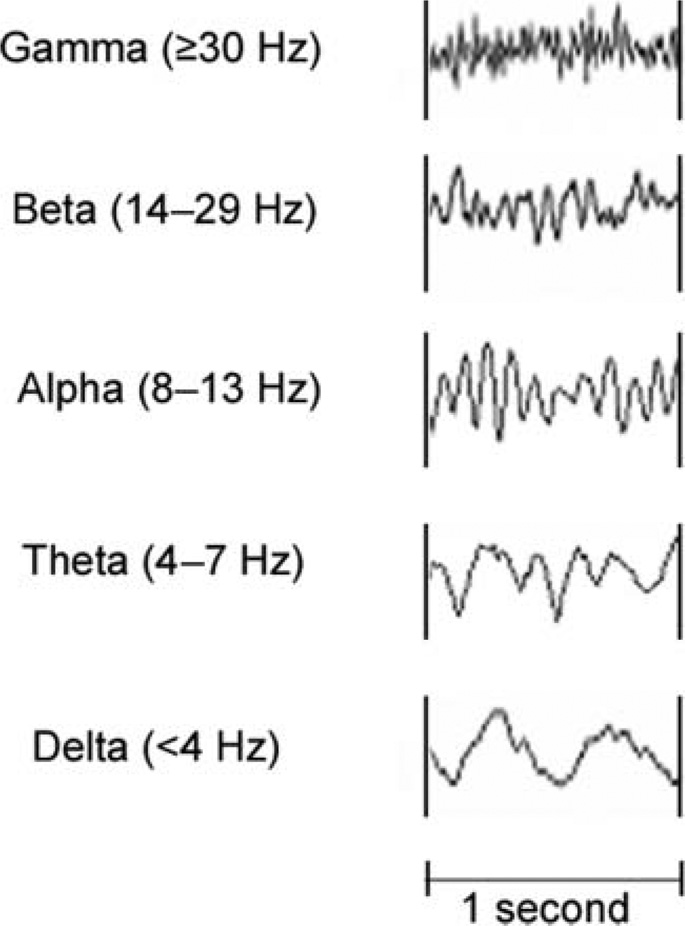
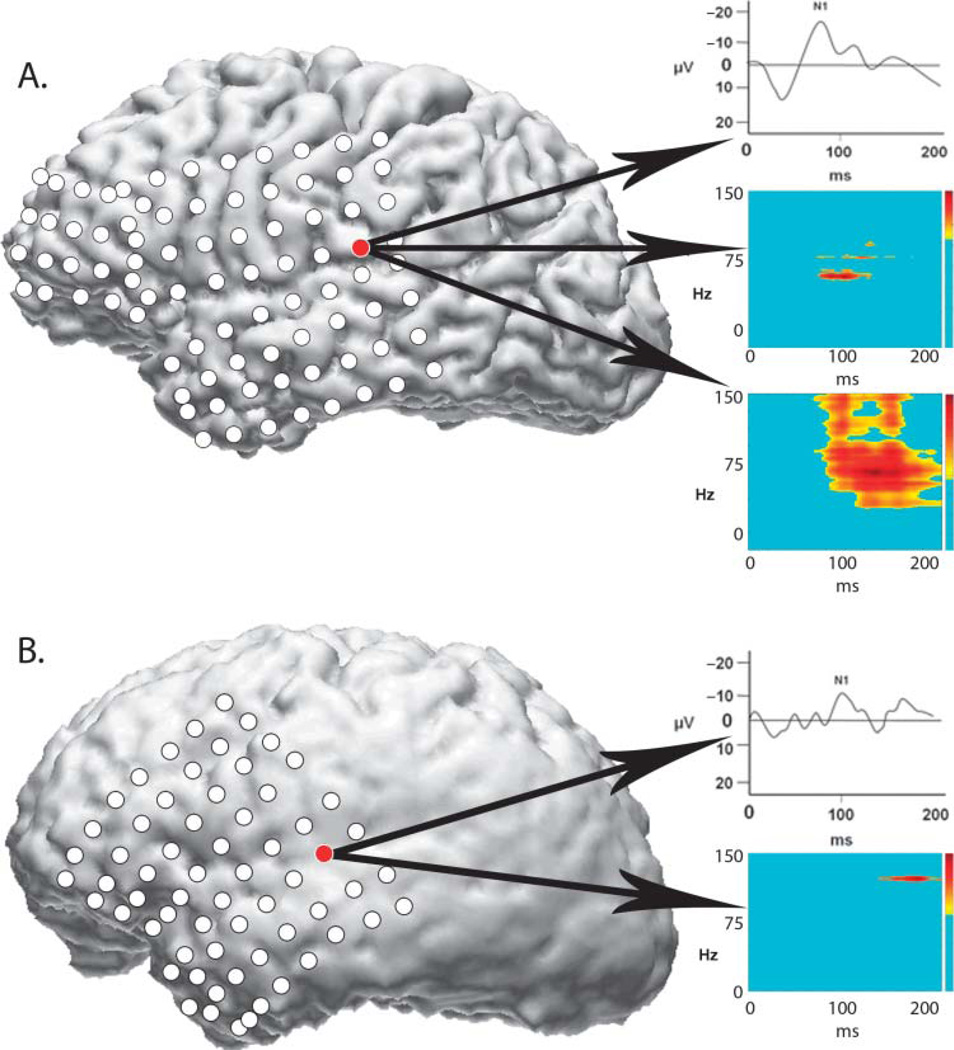
Purpose: This tutorial provides an introduction to cortical auditory spectral responses, focusing on event-related activity in the high-gamma frequencies (60-150 Hz), their recent emergence in neuroscience research, and potential clinical applications.
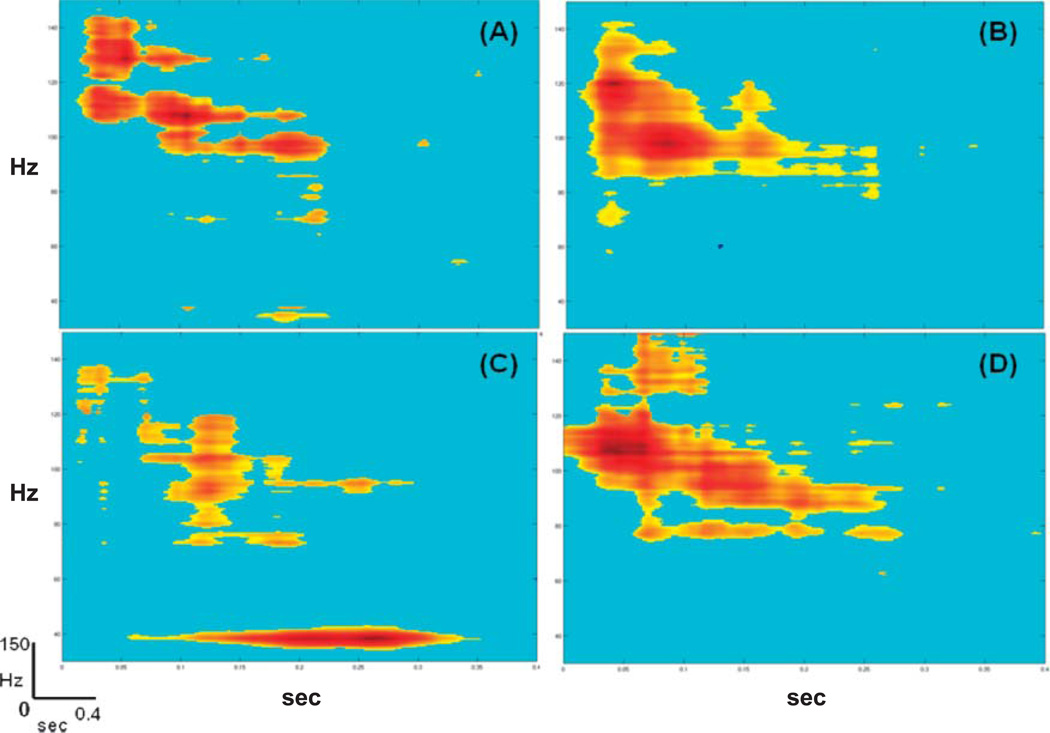
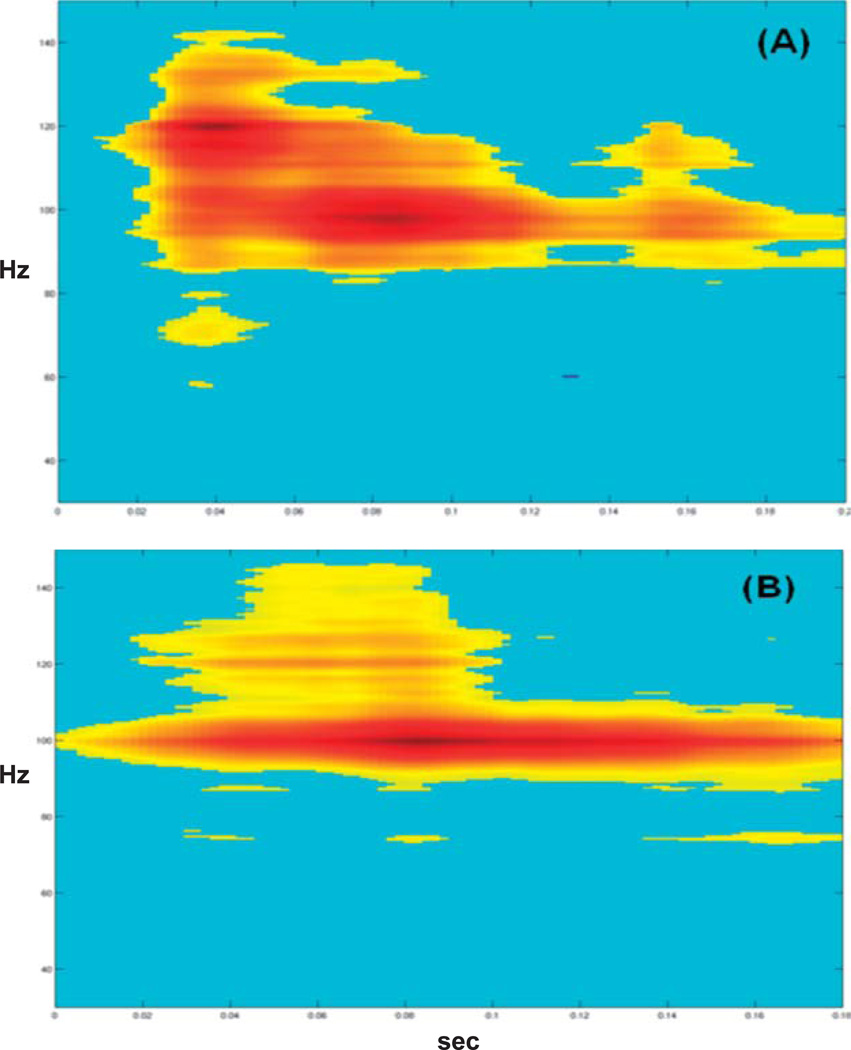
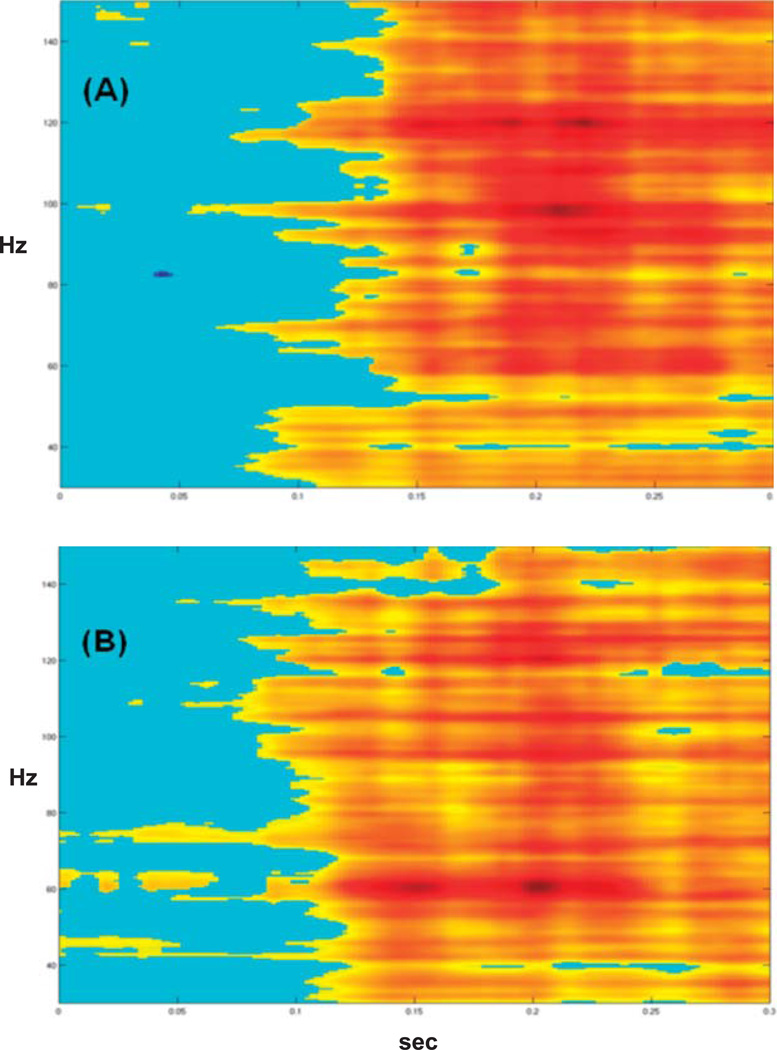
Method: Auditory high-gamma responses are described and compared with traditional cortical evoked responses, including the auditory evoked N1 response. Methods for acquiring and analyzing spectral responses, including time-frequency analyses, are discussed and contrasted with more familiar time-domain averaging approaches. Four cases are presented illustrating high-gamma response patterns associated with normal and impaired auditory processing.
Conclusions: Cortical auditory high-gamma responses may provide a useful clinical measure of auditory processing.
Figures
Similar articles
-
Reliability of early cortical auditory gamma-band responses.Clin Neurophysiol. 2013 Jan;124(1):70-82. doi: 10.1016/j.clinph.2012.06.003. Epub 2012 Jul 6. Clin Neurophysiol. 2013. PMID: 22771035 Free PMC article.
-
The frequency modulated auditory evoked response (FMAER), a technical advance for study of childhood language disorders: cortical source localization and selected case studies.BMC Neurol. 2013 Jan 25;13:12. doi: 10.1186/1471-2377-13-12. BMC Neurol. 2013. PMID: 23351174 Free PMC article.
-
Infant Cortical Auditory Evoked Potentials to Lateralized Noise Shifts Produced by Changes in Interaural Time Difference.Ear Hear. 2017 Jan/Feb;38(1):94-102. doi: 10.1097/AUD.0000000000000357. Ear Hear. 2017. PMID: 27505221
-
Asymmetric sampling in human auditory cortex reveals spectral processing hierarchy.PLoS Biol. 2020 Mar 2;18(3):e3000207. doi: 10.1371/journal.pbio.3000207. eCollection 2020 Mar. PLoS Biol. 2020. PMID: 32119667 Free PMC article.
-
Long Latency Auditory Evoked Responses in the Identification of Children With Central Auditory Processing Disorders: A Scoping Review.J Speech Lang Hear Res. 2022 Sep 12;65(9):3595-3619. doi: 10.1044/2022_JSLHR-21-00544. Epub 2022 Aug 29. J Speech Lang Hear Res. 2022. PMID: 36037462
Cited by
-
Direct recordings from the auditory cortex in a cochlear implant user.J Assoc Res Otolaryngol. 2013 Jun;14(3):435-50. doi: 10.1007/s10162-013-0382-3. Epub 2013 Mar 22. J Assoc Res Otolaryngol. 2013. PMID: 23519390 Free PMC article.
-
A Fuzzy Shell for Developing an Interpretable BCI Based on the Spatiotemporal Dynamics of the Evoked Oscillations.Comput Intell Neurosci. 2021 Apr 9;2021:6685672. doi: 10.1155/2021/6685672. eCollection 2021. Comput Intell Neurosci. 2021. PMID: 33936191 Free PMC article.
-
Reliability of early cortical auditory gamma-band responses.Clin Neurophysiol. 2013 Jan;124(1):70-82. doi: 10.1016/j.clinph.2012.06.003. Epub 2012 Jul 6. Clin Neurophysiol. 2013. PMID: 22771035 Free PMC article.
-
Listening in the Moment: How Bilingualism Interacts With Task Demands to Shape Active Listening.Front Neurosci. 2021 Dec 10;15:717572. doi: 10.3389/fnins.2021.717572. eCollection 2021. Front Neurosci. 2021. PMID: 34955707 Free PMC article.
-
EEG Correlates of Learning From Speech Presented in Environmental Noise.Front Psychol. 2020 Nov 5;11:1850. doi: 10.3389/fpsyg.2020.01850. eCollection 2020. Front Psychol. 2020. PMID: 33250798 Free PMC article.
References
-
- Adrian ED, Matthews BH. The Berger rhythm: Potential alterations form the occipital lobes in man. Brain. 1934;57:355–385.
-
- Alho K, Medvedev SV, Pakhomov SV, Roudas MS, Tervaniemi M, Reinikainen K, Naatanen R. Selective tuning of the left and right auditory cortices during spatially directed attention. Cognitive Brain Research. 1999;7:335–341. - PubMed
-
- American Speech-Language-Hearing Association. (Central) auditory processing disorders [Technical report] 2005 Available from www.asha.org/policy.
-
- American Speech-Language-Hearing Association, Task Force on Central Auditory Processing Consensus Development. Central auditory processing: Current status of research and implications for clinical practice. American Journal of Audiology. 1996;5(2):41–54.
-
- Ball T, Demandt E, Mutschler I, Neitzel E, Mehring C, Vogt K, Schulze-Bonhage A. Movement related activity in the high gamma range of the human EEG. NeuroImage. 2008;41:302–310. - PubMed
Publication types
MeSH terms
Grants and funding
LinkOut - more resources
Full Text Sources
