

Impact of release dynamics of laser-irradiated polymer micropallets on the viability of selected adherent cells
- PMID: 22158840
- PMCID: PMC3350736
- DOI: 10.1098/rsif.2011.0691
Impact of release dynamics of laser-irradiated polymer micropallets on the viability of selected adherent cells
Abstract
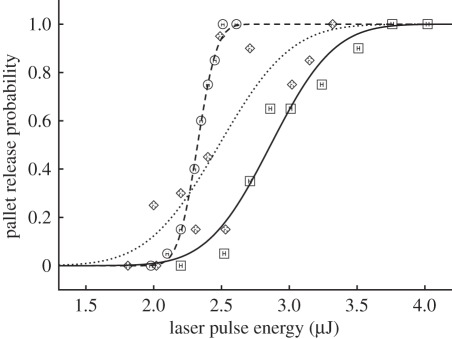
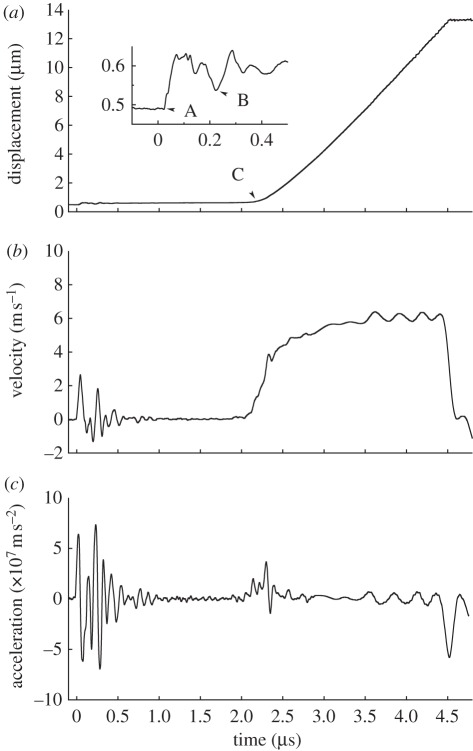
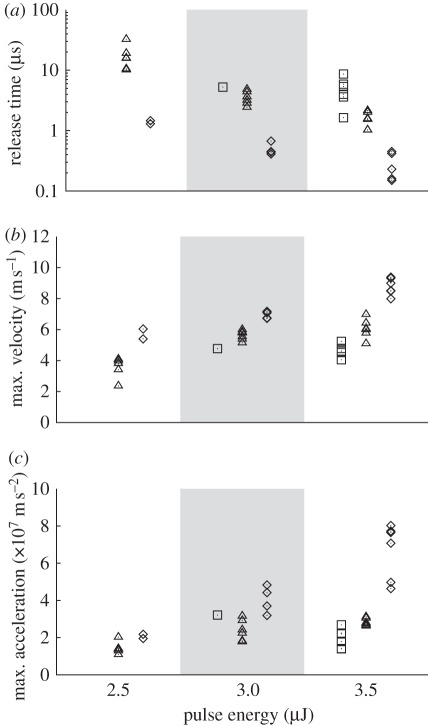
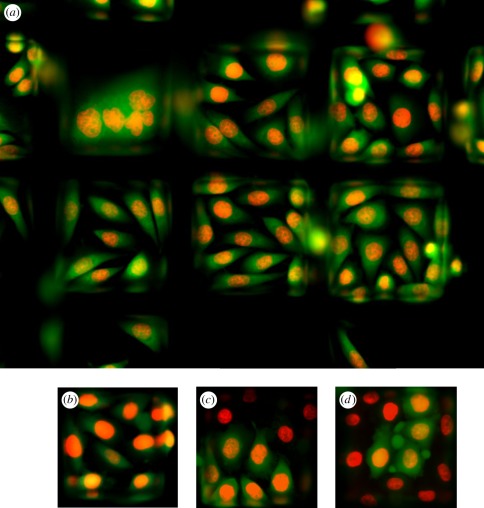
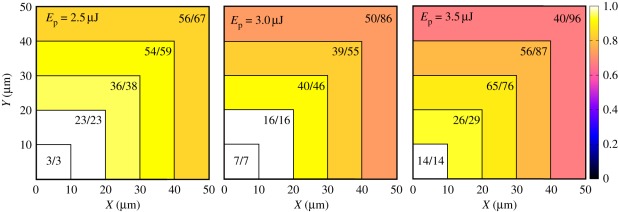
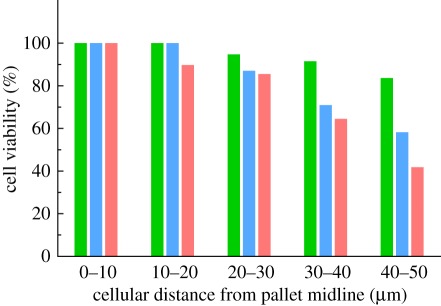
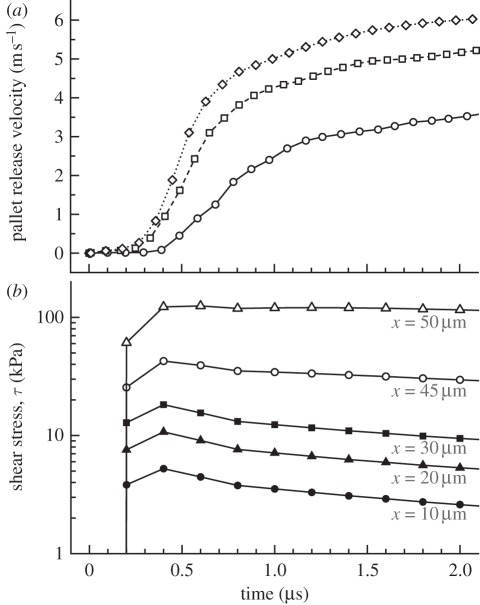
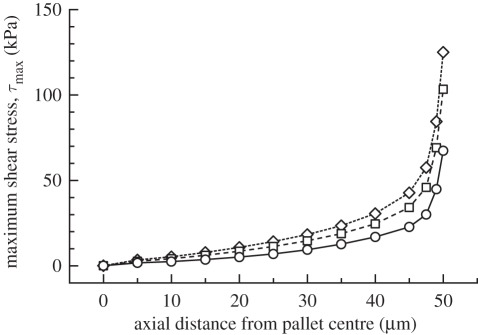
We use time-resolved interferometry, fluorescence assays and computational fluid dynamics (CFD) simulations to examine the viability of confluent adherent cell monolayers to selection via laser microbeam release of photoresist polymer micropallets. We demonstrate the importance of laser microbeam pulse energy and focal volume position relative to the glass-pallet interface in governing the threshold energies for pallet release as well as the pallet release dynamics. Measurements using time-resolved interferometry show that increases in laser pulse energy result in increasing pallet release velocities that can approach 10 m s(-1) through aqueous media. CFD simulations reveal that the pallet motion results in cellular exposure to transient hydrodynamic shear stress amplitudes that can exceed 100 kPa on microsecond timescales, and which produces reduced cell viability. Moreover, CFD simulation results show that the maximum shear stress on the pallet surface varies spatially, with the largest shear stresses occurring on the pallet periphery. Cell viability of confluent cell monolayers on the pallet surface confirms that the use of larger pulse energies results in increased rates of necrosis for those cells situated away from the pallet centre, while cells situated at the pallet centre remain viable. Nevertheless, experiments that examine the viability of these cell monolayers following pallet release show that proper choices for laser microbeam pulse energy and focal volume position lead to the routine achievement of cell viability in excess of 90 per cent. These laser microbeam parameters result in maximum pallet release velocities below 6 m s(-1) and cellular exposure of transient hydrodynamic shear stresses below 20 kPa. Collectively, these results provide a mechanistic understanding that relates pallet release dynamics and associated transient shear stresses with subsequent cellular viability. This provides a quantitative, mechanistic basis for determining optimal operating conditions for laser microbeam-based pallet release systems for the isolation and selection of adherent cells.
Figures
Similar articles
-
Hydrodynamic determinants of cell necrosis and molecular delivery produced by pulsed laser microbeam irradiation of adherent cells.Biophys J. 2013 Nov 5;105(9):2221-31. doi: 10.1016/j.bpj.2013.09.027. Biophys J. 2013. PMID: 24209868 Free PMC article.
-
Characterization of the laser-based release of micropallets from arrays.J Biomed Opt. 2008 May-Jun;13(3):034007. doi: 10.1117/1.2937475. J Biomed Opt. 2008. PMID: 18601552 Free PMC article.
-
Mechanisms of pulsed laser microbeam release of SU-8 polymer "micropallets" for the collection and separation of adherent cells.Anal Chem. 2008 Jun 15;80(12):4675-9. doi: 10.1021/ac800129a. Epub 2008 May 20. Anal Chem. 2008. PMID: 18489124 Free PMC article.
-
Principles of laser microdissection and catapulting of histologic specimens and live cells.Methods Cell Biol. 2007;82:153-205. doi: 10.1016/S0091-679X(06)82005-4. Methods Cell Biol. 2007. PMID: 17586257 Review.
-
Computational fluid dynamics for improved bioreactor design and 3D culture.Trends Biotechnol. 2008 Apr;26(4):166-72. doi: 10.1016/j.tibtech.2007.11.012. Epub 2008 Feb 7. Trends Biotechnol. 2008. PMID: 18261813 Review.
Cited by
-
Single cell isolation process with laser induced forward transfer.J Biol Eng. 2017 Jan 13;11:2. doi: 10.1186/s13036-016-0045-0. eCollection 2017. J Biol Eng. 2017. PMID: 28101134 Free PMC article.
-
Laser-based directed release of array elements for efficient collection into targeted microwells.Analyst. 2013 Feb 21;138(3):831-8. doi: 10.1039/c2an36342a. Epub 2012 Dec 5. Analyst. 2013. PMID: 23223411 Free PMC article.
-
Time-resolved digital holographic microscopy of laser-induced forward transfer process.Appl Phys B. 2014 Mar 1;114(3):361-366. doi: 10.1007/s00340-013-5524-0. Appl Phys B. 2014. PMID: 24748724 Free PMC article.
-
Efficient division and sampling of cell colonies using microcup arrays.Analyst. 2013 Jan 7;138(1):220-8. doi: 10.1039/c2an36065a. Epub 2012 Oct 25. Analyst. 2013. PMID: 23099535 Free PMC article.
-
Hydrodynamic determinants of cell necrosis and molecular delivery produced by pulsed laser microbeam irradiation of adherent cells.Biophys J. 2013 Nov 5;105(9):2221-31. doi: 10.1016/j.bpj.2013.09.027. Biophys J. 2013. PMID: 24209868 Free PMC article.
References
-
- Patel D. 2001. Separating cells. New York, NY: Springer
-
- Welm B., Behbod F., Goodell M. A., Rosen J. M. 2003. Isolation and characterization of functional mammary gland stem cells. Cell Prolif. 36, 17–3210.1046/j.1365-2184.36.s.1.3.x (doi:10.1046/j.1365-2184.36.s.1.3.x) - DOI - DOI - PMC - PubMed
-
- Seidl J., Knuechel R., Kunz-Schughart L. A. 1999. Evaluation of membrane physiology following fluorescence activated or magnetic cell separation. Cytometry 36, 102–11110.1002/(SICI)1097-0320(19990601)36:2%3C102::AID-CYTO3%3E3.0.CO;2-D (doi:10.1002/(SICI)1097-0320(19990601)36:2〈102::AID-CYTO3〉3.0.CO;2-D) - DOI - DOI - PubMed
-
- Schutze K., Lahr G. 1998. Identification of expressed genes by laser-mediated manipulation of single cells. Nat. Biotechnol. 16, 737–74210.1038/nbt0898-737 (doi:10.1038/nbt0898-737) - DOI - DOI - PubMed
-
- Schutze K., Posl H., Lahr G. 1998. Laser micromanipulation systems as universal tools in cellular and molecular biology and in medicine. Cell Mol. Biol. 44, 735–746 - PubMed
Publication types
MeSH terms
Substances
Grants and funding
LinkOut - more resources
Full Text Sources
Miscellaneous
