. 2012 Feb 1;72(3):769-78.
doi: 10.1158/0008-5472.CAN-11-2890. Epub 2011 Dec 12.

Nanocarriers enhance Doxorubicin uptake in drug-resistant ovarian cancer cells

Affiliations

Nanocarriers enhance Doxorubicin uptake in drug-resistant ovarian cancer cells

Hans C Arora et al. Cancer Res. .

Abstract

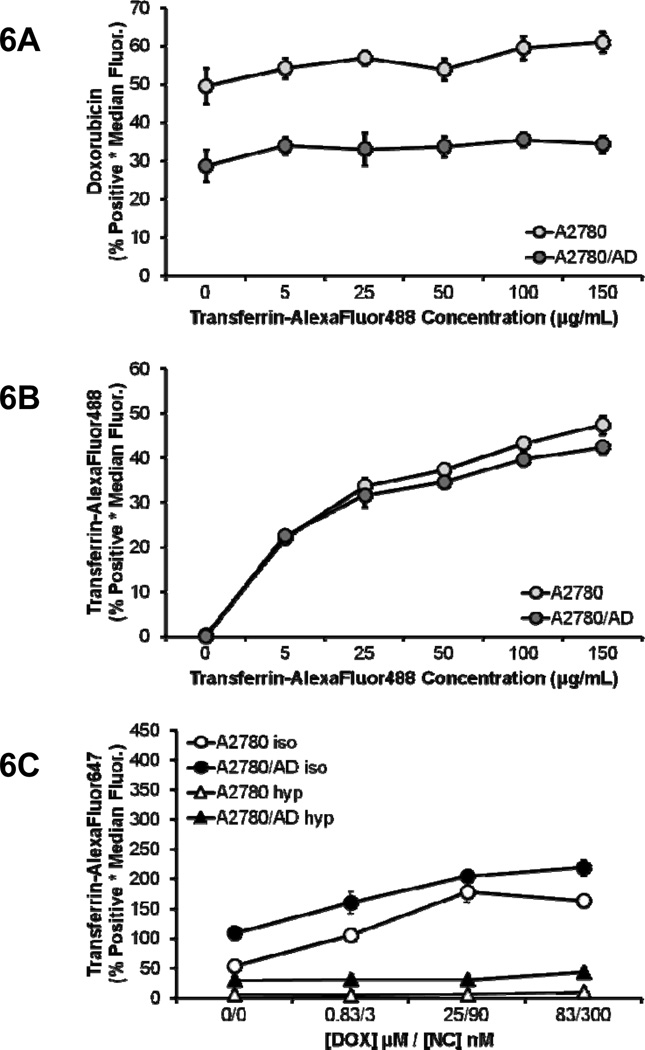
Resistance to anthracyclines and other chemotherapeutics due to P-glycoprotein (pgp)-mediated export is a frequent problem in cancer treatment. Here, we report that iron oxide-titanium dioxide core-shell nanocomposites can serve as efficient carriers for doxorubicin to overcome this common mechanism of drug resistance in cancer cells. Doxorubicin nanocarriers (DNC) increased effective drug uptake in drug-resistant ovarian cells. Mechanistically, doxorubicin bound to the TiO(2) surface by a labile bond that was severed upon acidification within cell endosomes. Upon its release, doxorubicin traversed the intracellular milieu and entered the cell nucleus by a route that evaded pgp-mediated drug export. Confocal and X-ray fluorescence microscopy and flow cytometry were used to show the ability of DNCs to modulate transferrin uptake and distribution in cells. Increased transferrin uptake occurred through clathrin-mediated endocytosis, indicating that nanocomposites and DNCs may both interfere with removal of transferrin from cells. Together, our findings show that DNCs not only provide an alternative route of delivery of doxorubicin to pgp-overexpressing cancer cells but also may boost the uptake of transferrin-tagged therapeutic agents.


Figures

Figure 1
Figure 1. Characterization of doxorubicin nanocomposites in solution
(A); UV-visible light absorption shows a pH dependence of DNC stability. (---) Doxorubicin and (—) DNC absorption spectra were measured at pH 2, 4 and 6. The main absorption peak of doxorubicin occurred at 484 nm at each pH tested. The main absorption peak of DNCs was shaped similarly to doxorubicin at pH 2, but DNCs at pH 6 and pH 4 displayed a red shift in absorption maximum to 494 nm and the presence of a right-handed shoulder (arrows; approximately 533 nm), suggesting binding between doxorubicin and nanocomposites, while a shift in absorption maximum back to 484 nm at pH 2 suggests subsequent dissociation. (B); Infrared spectra of KBr pellets of (a) doxorubicin, (b) DNCs, and (c) bare nanocomposites. Spectra between 600 and 2000 cm−1 of doxorubicin and DNCs do not show evidence for a strong polar covalent bidentate bonding between anthraquinone or phenolic oxygens of doxorubicin and the nanocomposite shell, but rather suggest formation of bonds involving hydroxyl groups indicated by circles in (C).
Figure 2
Figure 2. Conjugation to nanocomposites increases visible doxorubicin uptake in drug-resistant ovarian cancer cells
Cells were treated with 10 µM doxorubicin (DOX), 10 µM doxorubicin and 36 nM nanocomposites (NC+DOX) added to the media simultaneously at treatment, or 10 µM/36 nM DNCs. (A); A2780 cells treated with doxorubicin alone or co-treated with nanocomposites showed doxorubicin fluorescence mostly in the nucleus, while DNC-treated cells showed doxorubicin signal in both the nucleus and cytoplasm. Doxorubicin signal was stronger in the cytoplasm than nucleus, with occasional large vesicle-like structures (e.g one indicated by an arrowhead). (B); A2780/AD cells treated with doxorubicin alone or co-treated with nanocomposites showed almost no doxorubicin accumulation. DNC-treated cells showed doxorubicin signal in both the nucleus and cytoplasm. The doxorubicin distribution pattern with occasional prominent brightly fluorescent vesicles (arrowhead) is similar to A2780 cells treated with DNCs, but with lower signal intensity. 100x magnification.
Figure 3
Figure 3. X-ray fluorescence image with DNC nanoconjugates
(A); A2780 and (B); A2780/AD cells were treated 2h with 10 µM/36 nM DNCs. Elemental fluorescence for P, S, Ti, Fe and Zn is shown as a red temperature false color image with black as the lowest and white as the highest signal. Titanium K α fluorescence, indicating the location of the nanocomposites is notable only in the cytoplasm of both cell lines in a vesicle pattern; iron distribution follows the same pattern. Fluorescence of sulfur indicates the cell outline, the highest Zn signal shows the location of the nucleus. The cell diagram with three regions of interest: cell nucleus (pink +), cytoplasm (yellow+) and background (light blue +) is indicated as "ROI". Scatter plots show a linear correlation between titanium and iron because of the core-shell nanocomposite composition. At the same time, the Ti vs. Zn scatter plot shows that the highest Ti signal was found in those pixels that correspond to the cytoplasmic region of interest (yellow +), while the area with the highest Zn content (nucleus, pink +) has low Ti content. Phosphorous, sulfur, and zinc outline the cell, with greater intensity at the nucleus. Titanium and iron signal intensities are well-matched between cell lines. Scale bar = 2 micron.
Figure 4
Figure 4. Conjugation to nanocomposites increases doxorubicin uptake in A2780 and A2780/AD cells
(A) A2780 (light gray) and A2780/AD (dark gray) cells were treated with increasing concentrations of doxorubicin (△, triangles) or DNCs (○, circles) before analysis by flow cytometry. X-axis shows concentration of DNCs as conjoined concentrations of doxorubicin and nanocomposite components, or in the case of doxorubicin alone the first number gives the doxorubicin concentration. Y-axis is expressed in thousands (Supplemental Table 2). (B) A2780 (light gray) and A2780/AD (dark gray) cells were exposed to increasing concentrations of DNCs at 37°C (○, circles) and 4°C (□, squares) temperatures. Y-axis is expressed in thousands (Supplemental Table 3). (C); A2780 (light gray) and A2780/AD (dark gray) cells were treated under isotonic (○, circles) or hypertonic (△, triangles) incubation with increasing concentrations of DNCs and a constant concentration of 5 µg/mL transferrin-AlexaFluor647 before analysis by flow cytometry. An increase in DNC uptake was observed concurrent with increases in treatment concentration. Hypertonic treatment caused a decline in uptake, though not by more than 30–40% of the overall uptake indicating that clathrin-mediated endocytosis is only one of the possible endocytic mechanisms by which A2780 and A2780/AD cells take up DNCs. Y-axis is expressed in thousands (Supplemental Table 4). Error bars represent standard deviation (n=3). NOTE: Error bars are presented for each data point; however visual representation for small margins of error may be obscured by data markers.
Figure 5
Figure 5. Intracellular distribution of transferrin and doxorubicin delivered via DNCs
Cells were treated with 50 µg/mL transferrin-AlexaFluor647 and 10 µM/36 nM DNC for 30 minutes or 2 hours. Doxorubicin and AlexaFluor647 signals increased in both (A); A2780 and (B); A2780/AD cells with incubation time. Similarly to A2780 cells, AlexaFluor647 signals in A2780/AD cells show complete overlap with doxorubicin, though the vesicle distribution pattern appears different than in A2780 cells. Again, as in A2780 cells, all AlexaFluor647 signal is co-localized with doxorubicin, indicating that DNCs are not only taken up in the same endocytic vesicles as transferrin, but remain in them at this later timepoint. Doxorubicin released from nanocomposites follows the same distribution pattern as in A2780 cells: staining is mostly nuclear, with occasional doxorubicin-rich “blebs” in the nucleus and cytoplasm.
Figure 6
Figure 6. Transferrin uptake is increased in the presence of DNCs
DNCs at a constant concentration of 10 µM/36 nM were used to treat A2780 (light gray) and A2780/AD (dark gray) cells, increasing concentrations of transferrin-AlexaFluor488 before analysis by flow cytometry. (A); No increase in DNC uptake was observed in either cell line. (B); Transferrin uptake increased relative to increasing treatment concentrations. Y-axis is expressed in thousands for a product of median doxorubicin fluorescence within the gate for positive cells (in this experiment, at a DNC concentration of 10 µM/36 nM all cells in either cell line were positive for doxorubicin fluorescence) (Supplemental Table 6). (C); A2780 (white) and A2780/AD (black) cells were treated with 5 µg/mL transferrin-AlexaFluor647 and increasing concentrations of DNCs under either isotonic (○, circles) or hypertonic (△, triangles) conditions. AlexaFluor647 signal increased with increasing concentrations of DNCs, indicating increased uptake of transferrin. Hypertonic treatment significantly inhibited transferrin uptake in both cell lines, despite increasing concentrations of DNCs. Even under conditions where increased DNC concentration led to increased transferrin uptake, transferrin uptake remained dependent on CME. Y-axis is expressed in thousands (Supplemental Table 9). Error bars represent standard deviation (n=3).

References

    1. Schondorf T, Kurbacher CM, Gohring UJ, Benz C, Becker M, Sartorius J, et al. Induction of MDR1-gene expression by antineoplastic agents in ovarian cancer cell lines. Anticancer Res. 2002 Jul-Aug;22(4):2199–2203. - PubMed
    1. Linn SC, Giaccone G. Mdr1/P-Glycoprotein Expression in Colorectal-Cancer. European Journal of Cancer. 1995 Jul-Aug;31A(7–8):1291–1294. - PubMed
    1. Yu ST, Chen TM, Tseng SY, Chen YH. Tryptanthrin inhibits MDR1 and reverses doxorubicin resistance in breast cancer cells. Biochem Bioph Res Co. 2007 Jun 22;358(1):79–84. - PubMed
    1. Shen DW, Fojo A, Chin JE, Roninson IB, Richert N, Pastan I, et al. Human multidrug-resistant cell lines: increased mdr1 expression can precede gene amplification. Science. 1986 May 2;232(4750):643–645. - PubMed
    1. Minotti G, Menna P, Salvatorelli E, Cairo G, Gianni L. Anthracyclines: Molecular advances and pharmacologic developments in antitumor activity and cardiotoxicity. Pharmacological Reviews. 2004 Jun;56(2):185–229. - PubMed

Publication types

MeSH terms