. 2011 Dec 27;108(52):21206-11.
doi: 10.1073/pnas.1109000108. Epub 2011 Dec 8.

Niche specialization of terrestrial archaeal ammonia oxidizers

Affiliations

Niche specialization of terrestrial archaeal ammonia oxidizers

Cécile Gubry-Rangin et al. Proc Natl Acad Sci U S A. .

Abstract

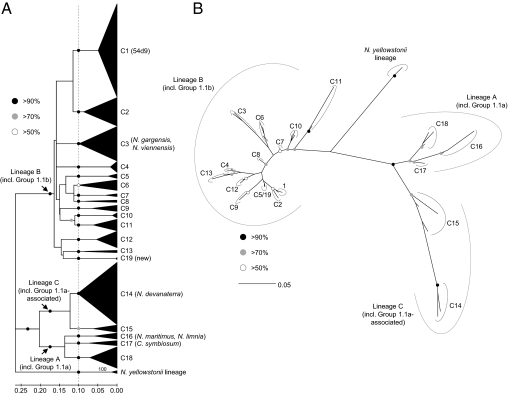
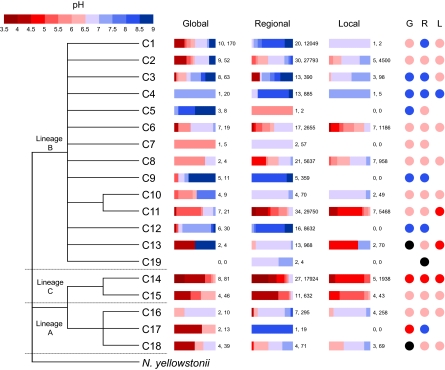
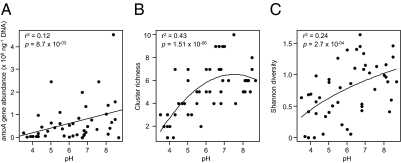
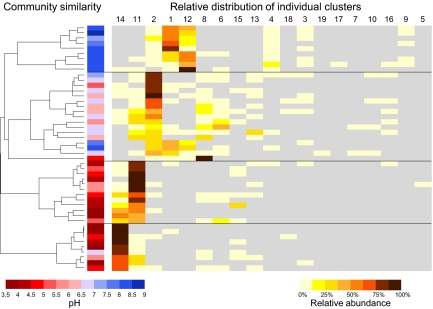
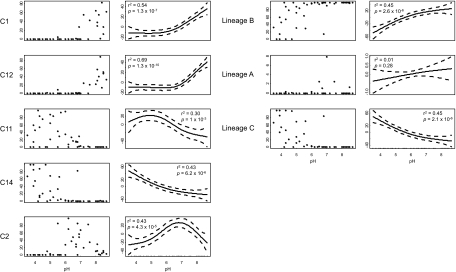
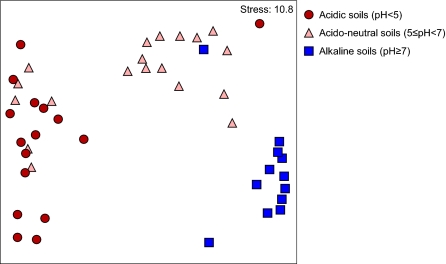
Soil pH is a major determinant of microbial ecosystem processes and potentially a major driver of evolution, adaptation, and diversity of ammonia oxidizers, which control soil nitrification. Archaea are major components of soil microbial communities and contribute significantly to ammonia oxidation in some soils. To determine whether pH drives evolutionary adaptation and community structure of soil archaeal ammonia oxidizers, sequences of amoA, a key functional gene of ammonia oxidation, were examined in soils at global, regional, and local scales. Globally distributed database sequences clustered into 18 well-supported phylogenetic lineages that dominated specific soil pH ranges classified as acidic (pH <5), acido-neutral (5 ≤ pH <7), or alkalinophilic (pH ≥ 7). To determine whether patterns were reproduced at regional and local scales, amoA gene fragments were amplified from DNA extracted from 47 soils in the United Kingdom (pH 3.5-8.7), including a pH-gradient formed by seven soils at a single site (pH 4.5-7.5). High-throughput sequencing and analysis of amoA gene fragments identified an additional, previously undiscovered phylogenetic lineage and revealed similar pH-associated distribution patterns at global, regional, and local scales, which were most evident for the five most abundant clusters. Archaeal amoA abundance and diversity increased with soil pH, which was the only physicochemical characteristic measured that significantly influenced community structure. These results suggest evolution based on specific adaptations to soil pH and niche specialization, resulting in a global distribution of archaeal lineages that have important consequences for soil ecosystem function and nitrogen cycling.


Conflict of interest statement

The authors declare no conflict of interest.

Figures

Fig. 1.
Fig. 1.
Phylogenetic analysis of thaumarchaeal amoA gene sequences from an alignment of 606 sequences from soil from 17 studies and reference sequences, plus sequences of a newly described cluster (C19). (A) DNA distance analysis of all sequences (i.e., general time-reversible correction, gamma-distributed rates of site variation, ML-estimated variable sites only, minimum evolution optimality criterion, 1,000 bootstrap replicates). Circles describe bootstrap support from distance methods only. Cultivated organisms (, , , –36) and those described by metagenomic analyses (32, 33) that are placed within specific clusters are highlighted. (B) Phylogenetic analysis of inferred amino acid sequences (194 positions) from a reduced representative selection of sequences from 19 clusters plus three sequences placed within the N. yellowstonii lineage (three sequences per cluster). Phylogenetic analyses were performed using four different methods: Bayesian (mixed model correction), ML [Le and Gascuel (LG), Jones, Taylor, and Thornton (JTT), Whelan and Goldman (WAG), and Dayhoff correction], maximum parsimony, and distance (JTT correction) using modeling of invariable sites and site rate heterogeneity where appropriate. Circles describing bootstrap support represent the most conservative value from bootstrap (1,000 replicates) or posterior probabilities (Bayesian) from all four methods.
Fig. 2.
Fig. 2.
Dendrogram showing the distribution of amoA gene sequences derived from soil within one of 19 distinct clusters within three lineages, defined here as A, B, and C, plus sequences within the N. yellowstonii lineage (17 of 19 with >90% bootstrap support; details shown in Fig. 1). Clusters were determined from a meta-analysis of amoA gene sequences in the NCBI database. The relative pH distribution of 606 sequences deposited in the NCBI database from 17 studies (global), 108,192 sequences from 47 soils in the United Kingdom (regional), and 14,644 sequences from seven soil samples from one site with a pH range of 4.5–7.5 (local) are shown. Numbers at the right of each bar represent the number of sites and total number of sequences analyzed for that particular cluster. Columns of circles labeled G, R, and L (for global, regional, and local) indicate whether the pH distribution of sequences classifies the phylogenetic cluster as acidic (red), acido-neutral (pink), alkalinophilic (blue), or not pH-adapted (black). All sequences analyzed are 586 nt long.
Fig. 3.
Fig. 3.
Relationships between soil pH and amoA gene abundance (A), cluster richness (B), and diversity (C). Regression coefficients of the best-fitting model and associated P values are indicated.
Fig. 4.
Fig. 4.
Dendrogram showing the relatedness of archaeal ammonia oxidizer community structures in a regional analysis of 47 soils (pH 3.5–8.7) based on the relative abundance of distinct lineages of archaeal amoA genes analyzed using 454 sequencing. The relative abundance of each lineage (clusters 1–19) in each soil is displayed in a heat map representation. The pH of soil from each site is indicated by red-blue panels, in the range 3.5–9 at intervals of 0.5. The relative abundance of sequences within an individual cluster in soil is indicated by yellow-brown shading at 12.5% intervals.
Fig. 5.
Fig. 5.
Relative abundances of selected amoA gene-defined lineages as a function of pH in a regional analysis of 47 UK soils. (Left) Influence of pH on the relative abundance of each of the five dominant archaeal amoA gene clusters. (Right) Relationships between pH and the distribution of the three major lineages A, B, and C. In each row, the first panel represents the percentage relative abundance of sequences belonging to a particular cluster, and the second panel represents the best-fitting model of this distribution. Regression coefficients and associated P values are indicated.
Fig. 6.
Fig. 6.
Nonmetric multidimensional scaling plot of archaeal ammonia oxidizer community structures in a regional analysis of 47 soils based on the relative abundance of sequences within clusters 1–19 in each soil. The first principal axis is dominated by soil pH effect, and each soil is placed within the acidic, acido-neutral, or alkaline category.

Similar articles

Cited by

References

    1. Curtis TP, Sloan WT, Scannell JW. Estimating prokaryotic diversity and its limits. Proc Natl Acad Sci USA. 2002;99:10494–10499. - PMC - PubMed
    1. Gans J, Wolinsky M, Dunbar J. Computational improvements reveal great bacterial diversity and high toxicity in soil. Science. 2005;309:1387–1390. - PubMed
    1. Philippot L, et al. The ecological coherence of high bacterial taxonomic ranks. Nat Rev Microbiol. 2010;8:523–529. - PubMed
    1. Griffiths RI, et al. The bacterial biogeography of British soils. Environ Microbiol. 2011;13:1642–1654. - PubMed
    1. Valentine DL. Adaptations to energy stress dictate the ecology and evolution of the Archaea. Nat Rev Microbiol. 2007;5:316–323. - PubMed

Publication types

MeSH terms

LinkOut - more resources