. 2011 Dec 7;31(49):17772-87.
doi: 10.1523/JNEUROSCI.3793-11.2011.

Encoding of both positive and negative reward prediction errors by neurons of the primate lateral prefrontal cortex and caudate nucleus

Affiliations

Encoding of both positive and negative reward prediction errors by neurons of the primate lateral prefrontal cortex and caudate nucleus

Wael F Asaad et al. J Neurosci. .

Abstract

Learning can be motivated by unanticipated success or unexpected failure. The former encourages us to repeat an action or activity, whereas the latter leads us to find an alternative strategy. Understanding the neural representation of these unexpected events is therefore critical to elucidate learning-related circuits. We examined the activity of neurons in the lateral prefrontal cortex (PFC) and caudate nucleus of monkeys as they performed a trial-and-error learning task. Unexpected outcomes were widely represented in both structures, and neurons driven by unexpectedly negative outcomes were as frequent as those activated by unexpectedly positive outcomes. Moreover, both positive and negative reward prediction errors (RPEs) were represented primarily by increases in firing rate, unlike the manner in which dopamine neurons have been observed to reflect these values. Interestingly, positive RPEs tended to appear with shorter latency than negative RPEs, perhaps reflecting the mechanism of their generation. Last, in the PFC but not the caudate, trial-by-trial variations in outcome-related activity were linked to the animals' subsequent behavioral decisions. More broadly, the robustness of RPE signaling by these neurons suggests that actor-critic models of reinforcement learning in which the PFC and particularly the caudate are considered primarily to be "actors" rather than "critics," should be reconsidered to include a prominent evaluative role for these structures.


Figures

Figure 1.
Figure 1.
Behavioral task and recording areas. A, A schematic representation of the behavioral task (see Materials and Methods). B, A typical recording session is shown with trial number along the x-axis and behavior (calculated using a 10-trial moving average) along the y-axis. Correct trials are represented by the green area, and incorrect choices are shown in red. The other colors represent procedural errors; neuronal activity from these latter trial types, reflecting technical errors rather than decisional ones, was not used in any analysis. The vertical lines represent reversals between blocks, and the numbers at the bottom of each block represents the particular cue (1–4) or direction (5–8) that was designated correct during that block. C, T1-weighted MRIs with fiducal markers placed within the recording chambers to demonstrate a subset of trajectories into the left lateral prefrontal cortex of each monkey, M1 and M2. PS, Principal sulcus. D, Fiducial markers within the posterior portion of the same recording chambers demonstrate sample electrode trajectories into the anterior caudate nucleus.
Figure 2.
Figure 2.
Behavioral performance and strategy. A, B, Percentage correct as a function of trial number within a block for subjects M1 and M2, is plotted separately as a function of learning rule (“object” or “spatial”). The shaded area bounds the mean ±SE. Animals learned more quickly in spatial learning blocks than in object-learning blocks. C, D, Behavioral strategy following a UP trial is shown. If subjects were using a spatial strategy, then the occurrence of an UP outcome should lead them to repeat the chosen direction, regardless of the object that had cued that direction (i.e., “repeat spatial”). If they were using an object-based strategy, they should instead “follow the object” that had cued the correct location just chosen, wherever it appears on the subsequent trial (“repeat object”). The initial strategy used by each animal (based on the first 3 occurrences of UP trials in each block) was influenced by the type of the preceding block, but was generally biased toward a spatial strategy. This dependency on the preceding block type weakened as the number of trials into a block increased, although it was still evident across the entire block (data not shown). The probability of selecting the same direction or object by chance was 0.25 (indicated by the dashed line). A three-way ANOVA with main factors of (1) previous block type (spatial vs object); (2) current block-type; and (3) strategy (i.e., repeat spatial vs repeat object) revealed a significant main effect of strategy (M1: p < 0.0001; M2: p < 0.0001), and a significant interaction between previous block type and strategy (M1: p = 0.0057; M2: p = 0.0014). No other main effects or interactions were significant in either subject. E, F, Behavioral strategy after UN trials is plotted as a function of trial number within a block. The chance probability of reselecting either the same object or direction was 0.4375 (indicated by the dashed line). For each subject, performance returned approximately to chance after any incorrect trial, regardless of its timing within a block. Over all trials, M1 was slightly less likely to repeat the same object or direction after an error (p = 0.025), whereas the pattern of choices made by M2 did not differ from chance (p = 0.402). G, The likelihood of a correct choice after n-consecutive incorrect trials is plotted for each subject. Subject M1 was slightly more likely than M2 to make a correct response after an incorrect response (likely related to this subject's slightly greater tendency to avoid reselecting a previously chosen object or direction, as shown in E). However, there was no large variation in performance as a function of the number of consecutive incorrect choices for either subject, suggesting they relied predominantly on a guessing strategy, rather than accumulate information from each consecutive incorrect response.
Figure 3.
Figure 3.
Incidence of specific behavioral patterns. A, B, The relative incidence of particular sequences of behavioral outcomes is plotted for M1 (A) and M2 (B). Each of the 64 possible 6-trial sequences of correct (labeled “1”) and incorrect (“0”) outcomes is arranged along the y-axis in order of frequency. The proportion of all 6-trial segments corresponding to that pattern is shown on the x-axis, to the right (in blue). The total fraction represented by the first bar (indicated by an asterisk) was 0.61 and 0.66 for M1 and M2, respectively. The red bars to the left reflect the number of transitions between correct and incorrect trials contained in each sequence. For example, the sequence “110110” has 3 transitions (trials 2–3, 3–4, and 5–6). The inset plots the frequency of these different patterns according to the numbers of transitions they contain. These plots provide a measure of behavioral stability, and also would reflect reliance on idiosyncratic strategies that depend upon particular sequences of outcomes. The simplest sequences are most common. Therefore, most unexpected responses occur in regimes of relatively stable behavior.
Figure 4.
Figure 4.
Single neuron examples. A, Top, This caudate neuron demonstrated a feedback-related response to unexpectedly positive outcomes. A slight depression of activity was seen for both expected and unexpected negative outcomes. Activity was less modulated by expected positive outcomes. This neuron recapitulated the pattern of activity described by others for midbrain dopamine neurons. Neuronal activity was smoothed with a sliding Gaussian kernel with σ = 50 ms. The left-side portion of the figure is aligned to the cue onset (at 0 ms); fixation onset occurred at −1000 ms and cue offset occurred at 500 ms, both marked by vertical lines. The right-side portion of the figure is aligned to the onset of visual feedback (at 0 ms), while offset of visual feedback occurred at 500 ms, coincident with the onset of reward delivery in correct trials. Green, UP; black, EP; blue, UN; red, EN. Middle, A sliding ROC comparing UP and EP responses. Deviations >0.5 indicate the UP response was greater than the EP response; those <0.5 reflect greater activity for the EP than for the UP condition. Each bar is color-coded to represent the p value calculated from a bootstrap distribution created for each 200 ms bin, slid in 50 ms steps. Bottom, The sliding ROC comparing UN and EN responses. Deviations >0.5 indicate greater activity in UN trials whereas deviations <0.5 reflect greater activity in EN trials. Conventions in BG are as for A. B, This caudate neuron showed greater activity, beginning during visual feedback, for UN outcomes. C, A PFC neuron that showed greater activity for EN outcomes. D, A PFC neuron that exhibited greater activity on trials with EP outcomes. This neuron also had a small selective response on UN trials. E, This caudate neuron displayed brief phasic responses of approximately similar magnitude to both UP and UN outcomes. F, This PFC neuron had a larger, earlier response to UN outcomes followed by a smaller response to UP outcomes. It also had greater activity earlier in the trial around the time of the cue and early delay period, when the previous trial was correct, as suggested by the slight separation between UN and EP trials (which are preceded by correct trials) from UP and EN trials (which are preceded by incorrect trials), similar to what has been reported previously by others (Seo et al., 2007; Histed et al., 2009). G, A PFC neuron that displayed a small early response to EN outcomes, but a larger and more sustained response to UP outcomes. This neuron also demonstrated slightly increased firing rates during the delay period when the previous trial was incorrect.
Figure 5.
Figure 5.
Prevalences and magnitudes of the four types of outcome-related responses. A, This bar graph depicts the fraction of neurons within the lateral PFC (black) or caudate nucleus (gray) of subject M1 that exhibited each category of outcome-related response. A neuron was counted as responding to a particular outcome category if it had at least one time bin (after feedback onset) that was significant in the relevant ROC analysis (see Materials and Methods). Fractions sum to greater than one within each area because neurons could display more than one response type. Numerical values are included in Table 1. B, Data from subject M2 displayed in the same manner as in A.
Figure 6.
Figure 6.
The independent contributions of preceding trials to spike rates. A, The discriminability of spike rates by ROC in a given index trial, n, afforded by the outcome of a preceding trial (n-1 through n-5) is plotted (see Materials and Methods). ROCs for activity corresponding to each of the four categories of outcome are plotted separately. Here, the contributions of preceding trial outcomes to neuronal activity are shown for the PFC of subject M1. Most of the ability to discriminate spike rates was indeed found in the outcome of the immediately preceding trial. The colored dots identify which points were significantly above chance for the population. B—D, The contribution of preceding trials to spiking activity in the PFC of M2 (B), the caudate of M1 (C), and the caudate of M2 (D) were similar. Note that it was possible that the neural responses to different outcome categories could have been differently influenced by preceding outcomes; however, after correcting for the number of pairwise comparisons, no such differences were found to be significant.
Figure 7.
Figure 7.
The contribution of behavioral factors on preceding trials to neuronal activity. The contribution of the correctness, the chosen object, and the chosen spatial location on preceding trials to outcome-related neuronal activity was assessed with multiple linear regression. In neither area and in neither animal were chosen object or location significant regressors on any preceding trial. Plotted here are the regression coefficients for each type of outcome-related response, as a function of the correctness of the N-back trial. A, The data for PFC neurons in subject M1. Positive deflections indicate a positive contribution of a preceding correct trial at that lag, and negative deflections indicate a positive contribution of an incorrect trial at that lag. Therefore, UP and EN responses, which are by definition based upon a preceding incorrect trial, both deflect negatively; meanwhile UN and EP responses, which are identified based upon a preceding correct response, both deflect positively. In this animal, the UP and EN activity of PFC neurons tended to be significantly influenced by outcomes several trials into the past, but the largest contributor was the immediately preceding trial (n-1). B, The data for caudate neurons in subject M1. C, The data for PFC neurons in subject M2. The contribution of more distant trials was not replicated in this animal. D, The data for caudate neurons in subject M2. In all cases, as for the independent ROC method (Fig. 6), the immediately preceding trial was indeed the most potent influence on outcome-related neuronal activity.
Figure 8.
Figure 8.
Relative contributions of the prior versus the current trial's outcome on neuronal activity. A, A positive index reflected neuronal activity that was driven primarily by the prior trial's outcome, whereas a negative index reflected activity that was more related to the current trial's outcome (see Materials and Methods). Here, the data from subject M1 is shown. A scatter plot is shown depicting the mean pre-feedback-onset and post-feedback-onset indices for each neuron. Population histograms depicting these preindices and postindices are shown along the x- and y-axes, respectively, with the mean of each distribution depicted by a solid black line. The means of these distributions were 0.12 and −0.26, respectively, each differing significantly from zero (p < 0.00001 in each case, by two-tailed t test). B, The data from subject M2 is plotted as in A. The means of the pre-feedback-onset and post-feedback-onset index distributions were 0.17 and −0.18, respectively. These also significantly differed from zero (p < 0.00001 in each case). Splitting the data to consider neurons recorded from either the PFC alone or from the caudate alone (independently for each subject) did not change the pattern or significance of these results.
Figure 9.
Figure 9.
Overlap fractions between pairs of outcome types. The overlap fraction between each pair is shown by the thickness of the lines connecting them (as indicated by the thickness scale and numerical values in Table 3). The significance of these values, factoring in the baseline frequencies of each outcome type, is depicted by the color of the lines. A, The overlap fractions for outcomes in the PFC of M1. B, The overlap fractions for the outcomes in the PFC of M2. C, The overlap fractions for the outcomes in the caudate of M1. D, The overlap fractions for the outcomes in the caudate of M2. There was no evidence for an increased or decreased tendency for UP- or UN-selective responses to be found in the same neurons. Note that the decreased tendency for UP-EP and UN-EN pairings is a consequence of the analysis structure (see Materials and Methods).
Figure 10.
Figure 10.
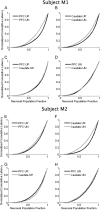
Latencies to the appearance of UP or UN activity. A, The cumulative latencies to the first time bin during the feedback period at which significant UP or UN activity was detected are plotted for the PFC neuronal population in subject M1 (see Materials and Methods for details). Lower values indicate lower latencies. UP activity tended to arrive earlier than UN activity (p < 0.001). B, The cumulative latencies for UP and UN activity in the caudate of M1 are plotted. Again, UP activity tended to arrive earlier than UN activity (p = 0.003). C, No difference between the latencies of arrival of UP activity across the PFC and caudate were observed (p = 0.700). D, No difference was observed between the latencies of arrival of UN activity across the PFC and caudate (p = 0.638). E–H, The same data are shown for subject M2. A significant difference was observed between the latencies for UP and UN activity in the caudate (F: p = 0.033), but not in the PFC (E: p = 0.232). Again, there were no differences observed across areas (G: p = 0.374 for UP activity; H: p = 0.602 for UN activity).
Figure 11.
Figure 11.
Association between neuronal activity and subsequent behavioral choice. A, This histogram plots the difference in PFC neuronal activity (Δ spikes/s) between UP trials that were followed by a new behavioral choice (i.e., chosen direction) minus UP trials followed by the same behavioral choice (see Materials and Methods for details). Data from both subjects were included. The y-axis shows the number of neurons with the specified difference in neuronal activity indicated on the x-axis. If the activity of these UP-selective neurons was linked to behavior, greater activity on UP trials should more often lead to appropriate repetition of the same behavioral response, and so the plotted differences should generally be negative across the population. The slight leftward shift here (UP-then-new < UP-then-same) is consistent with this notion. The red line is the population mean (p = 0.024 by two-tailed t test). B, Here, the difference between UN trials followed by a new behavioral choice minus UN trials followed by the same choice is plotted for neuronal activity in the PFC of both subjects. Greater activity on UN trials should be associated with the more appropriate selection of a new choice on the subsequent trial. The population's small rightward shift here (UN-then-new > UN-then-same) is consistent with this idea (p = 0.010 by two-tailed t test). C, D, There was no significant association between the level of neuronal activity on UP or UN trials in the caudate and subsequent behavioral choice, as shown in C and D, respectively (p > 0.5 in both cases).

References

    1. Abler B, Walter H, Erk S, Kammerer H, Spitzer M. Prediction error as a linear function of reward probability is coded in human nucleus accumbens. Neuroimage. 2006;31:790–795. - PubMed
    1. Aosaki T, Kimura M, Graybiel AM. Temporal and spatial characteristics of tonically active neurons of the primate's striatum. J Neurophysiol. 1995;73:1234–1252. - PubMed
    1. Asaad WF, Eskandar EN. A flexible software tool for temporally-precise behavioral control in Matlab. J Neurosci Methods. 2008;174:245–258. - PMC - PubMed
    1. Asaad WF, Rainer G, Miller EK. Neural activity in the primate prefrontal cortex during associative learning. Neuron. 1998;21:1399–1407. - PubMed
    1. Barnes TD, Kubota Y, Hu D, Jin DZ, Graybiel AM. Activity of striatal neurons reflects dynamic encoding and recoding of procedural memories. Nature. 2005;437:1158–1161. - PubMed

Publication types

LinkOut - more resources