. 2011 Dec 7;31(49):17811-20.
doi: 10.1523/JNEUROSCI.4790-11.2011.

Stimulus-specific adaptation: can it be a neural correlate of behavioral habituation?

Affiliations

Stimulus-specific adaptation: can it be a neural correlate of behavioral habituation?

Shai Netser et al. J Neurosci. .

Abstract

Habituation is the most basic form of learning, yet many gaps remain in our understanding of its underlying neural mechanisms. We demonstrate that in the owl's optic tectum (OT), a single, low-level, relatively short auditory stimulus is sufficient to induce a significant reduction in the neural response to a stimulus presented up to 60 s later. This type of neural adaptation was absent in neurons from the central nucleus of the inferior colliculus and from the auditory thalamus; however, it was apparent in the OT and the forebrain entopallium. By presenting sequences that alternate between two different auditory stimuli, we show that this long-lasting adaptation is stimulus specific. The response to an odd stimulus in the sequence was not smaller than the response to the same stimulus when it was first in the sequence. Finally, we measured the habituation of reflexive eye movements and show that the behavioral habituation is correlated with the neural adaptation. The finding of a long-lasting specific adaptation in areas related to the gaze control system and not elsewhere suggests its involvement in habituation processes and opens new directions for research on mechanisms of habituation.


Figures

Figure 1.
Figure 1.
A single-site example of adaptation to a repeated auditory stimulus with an ISI of 30 s. A, The raster plot in the upper panel shows responses to the first stimulus in the sequence. The raster plot in the lower panel shows responses to the last stimulus in the sequence. The gray area represents the stimulus duration. B, The PSTH of the responses to the first stimulus (black curve) compared to the PSTH of the responses to the last stimulus (gray curve). Auditory stimulus was broadband (3–10 kHz) and 400 ms long with an ITD of −3 μs and ILD of −1 dB.
Figure 2.
Figure 2.
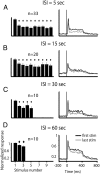
Neural adaptation in the OT with ISIs of 5–60 s. A, Population response to stimulation with an ISI of 5 s. The histogram on the left shows the population response to an auditory stimulus as a function of its position in the sequence. Error bars designate SEMs. Diamonds designate responses that were significantly smaller than the response to the first stimulus in the sequence (t test, Holm–Bonferroni correction, p < 0.05). The number above the histogram indicates the number of recording sites. On the right, the population PSTH of the response to the first stimulus (black curve) is compared to the population PSTH of the response to the last stimulus in the sequence (45 s later, gray curve). B, Population response to stimulation with an ISI of 15 s. The histogram on the left shows the population response to the stimulus as a function of its position in the sequence. On the right, the population PSTH of the response to the first stimulus (black curve) is compared to the population PSTH of the response to the last stimulus in the sequence (135 s later, gray curve). The format is as in A. C, Population response to stimulation with an ISI of 30 s. The histogram on the left shows the population response to the stimulus as a function of its position in the sequence. On the right, the population PSTH of the response to the first stimulus (black curve) is compared to the population PSTH of the response to the last stimulus in the sequence (120 s later, gray curve). The format is as in A. D, Population response to stimulation with an ISI of 60 s. The histogram on the left shows the population response to the stimulus as a function of its position in the sequence. On the right, the population PSTH of the response to the first stimulus (black curve) is compared to the population PSTH of the response to the last stimulus in the sequence (120 s later, gray curve). The format is as in A.
Figure 3.
Figure 3.
Neural adaptation in different brain nuclei. The inset shows a scheme of a lateral view of the barn owl's brain. Seven nuclei are marked in the scheme. The arrows indicate the typical direction of information flow. The histograms show the population response, in each of the nuclei examined, as a function of the position of the stimulus in the sequence. Below each histogram, the population PSTH of the response to the first stimulus (dark curve) is compared to the population PSTH of the response to the last stimulus in the sequence (light curve). The colors of the bars and curves correspond to the colors of the corresponding nuclei in the inset. The error bars designate SEMs. The diamonds indicate responses that were significantly smaller from the response to the first stimulus in the sequence (t test, Holm–Bonferroni correction; p < 0.05). nRt, Nucleus rotundus.
Figure 4.
Figure 4.
Neural adaptation in the E with ISIs of 30 and 60 s. A, A single-site example of adaptation in the E to a repeated auditory stimulus with an ISI of 30 s. The raster plot in the upper panel shows responses to the first stimulus in the sequence. The raster plot in the lower panel shows responses to the last (fifth) stimulus in the sequence. The gray area represents the stimulus duration. B, Population responses in the E to sequences with an ISI of 30 s. The format is as in Figure 2A. C, Population responses in the E to sequences with an ISI of 60 s. The format is as in Figure 2A.
Figure 5.
Figure 5.
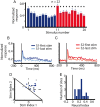
Long-lasting adaptation in the OT is stimulus specific. A, The population response as a function of the position of the stimulus in the sequence (ISI = 10 s). The blue bars (positions 1–10) designate the responses to the 10 repetitions of stimulus 1 and the red bars (positions 11–20) to the 10 repetitions of stimulus 2. The two stimuli differ by their central frequency (ΔF = 2 kHz). Error bars indicate SEMs. Diamonds represent responses that were significantly lower than the response to the same stimulus when it was first in its sequence (t test, Holm–Bonferroni correction; p < 0.05). B, Population PSTH curve of the response to stimulus 1 when it was first in its sequence compared to population PSTH curve of the response to stimulus 1 when it was last in its sequence. The abscissa shows the time relative to the onset of stimulation. C, Same as in B but showing responses to stimulus 2. D, A scatter plot showing the distribution of stimulus indices of stimulus 2 versus stimulus 1. Blue dots represent results from multiunit recordings and gray dots from single-unit recordings. The dashed lines mark the quadrant in which both indices are positive. E, The distribution of neural indices from all tests.
Figure 6.
Figure 6.
Neural responses, spectrograms and waveforms of the natural sounds used in this study. The raster plots on the left show neural responses from three tectal sites to the six sounds. Each raster plot show responses to 10 repetitions of the sound whose waveform and spectrogram are shown in the corresponding middle and right columns respectively. The upper two rasters show responses from one recording site, the middle two rasters from a different recording site, and the lower two rasters from a third recording site.
Figure 7.
Figure 7.
Adaptation in the OT to playback of natural sounds. A, The population response as a function of the position of the stimulus in the sequence (ISI = 13 s). The blue bars designate the responses to the seven repeated presentations of the standard stimulus and the red bar designates the response to the last odd stimulus. Error bars indicate SEMs. Diamonds indicate responses that were significantly smaller than the response to the first stimulus (t test, Holm–Bonferroni correction; p < 0.05). Asterisks indicate responses that were significantly smaller than the response to the last odd stimulus (t test, Holm–Bonferroni correction; p < 0.05). B, The population PSTH curves of the response to the first stimulus (blue curve) compared to the average population PSTH curves of the responses to stimuli 5–7 (purple curve) and the population PSTH curve of the response to the last odd stimulus (red curve). C, The population response as a function of the position of the stimulus in the sequence (ISI = 60 s). The blue bars designate the average responses to the first two identical stimuli and the red bar designates the average response to the third odd stimulus. D, The population PSTH curves. The format is as in B.
Figure 8.
Figure 8.
Habituation of reflexive eye movements. A, The population pecten responses of the right eye to a sequence of six auditory stimuli presented, with an ISI of 13 s, from a speaker on the right side. The error bars designate SEMs. The gray diamonds indicate responses that were significantly smaller than the response to the first stimulus in the sequence (t test, Holm–Bonferroni correction; p < 0.05). The inset displays a video frame showing the infrared light reflected from the right eye. The edge of the pecten oculi is marked by the arrow. B, The population pecten responses of the right eye to a sequence of six auditory stimuli presented, with an ISI of 13 s, from a speaker on the left side. The format is as in A. C, The population pecten responses of the right eye to a sequence of eight auditory stimuli of which the eighth stimulus was different. The black bars indicate the responses to the seven repeated presentations of the same standard stimulus. The gray bar shows the average response to the last odd stimulus. Auditory stimuli were presented through earphones with an ITD of +80 μs (right ear leading). Error bars indicate SEMs. Diamonds indicate responses that were significantly smaller than the response to the first stimulus (t test, Holm–Bonferroni correction; p < 0.05). Asterisks indicate responses that were significantly smaller than the response to the last odd stimulus.

Similar articles

Cited by

References

    1. Anderson LA, Christianson GB, Linden JF. Stimulus-specific adaptation occurs in the auditory thalamus. J Neurosci. 2009;29:7359–7363. - PMC - PubMed
    1. Antunes FM, Nelken I, Covey E, Malmierca MS. Stimulus-specific adaptation in the auditory thalamus of the anesthetized rat. PLoS One. 2010;5:e14071. - PMC - PubMed
    1. Arthur BJ. Distribution within the barn owl's inferior colliculus of neurons projecting to the optic tectum and thalamus. J Comp Neurol. 2005;492:110–121. - PubMed
    1. Bala AD, Takahashi TT. Pupillary dilation response as an indicator of auditory discrimination in the barn owl. J Comp Physiol A. 2000;186:425–434. - PubMed
    1. Bala AD, Spitzer MW, Takahashi TT. Prediction of auditory spatial acuity from neural images on the owl's auditory space map. Nature. 2003;424:771–774. - PubMed

Publication types

LinkOut - more resources