

Binocular disparity tuning and visual-vestibular congruency of multisensory neurons in macaque parietal cortex
- PMID: 22159105
- PMCID: PMC3260792
- DOI: 10.1523/JNEUROSCI.4032-11.2011
Binocular disparity tuning and visual-vestibular congruency of multisensory neurons in macaque parietal cortex
Abstract
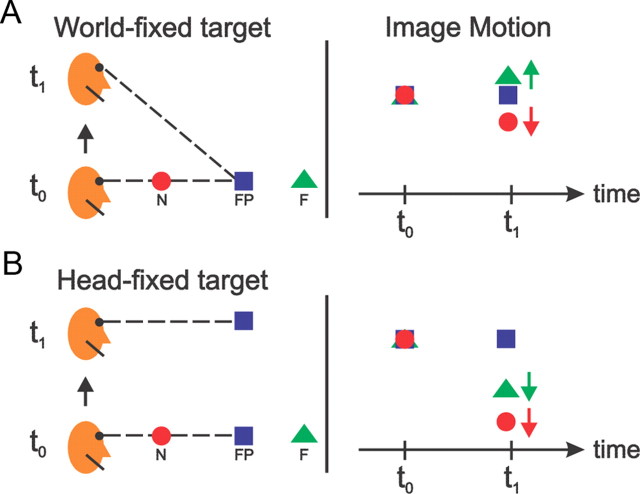
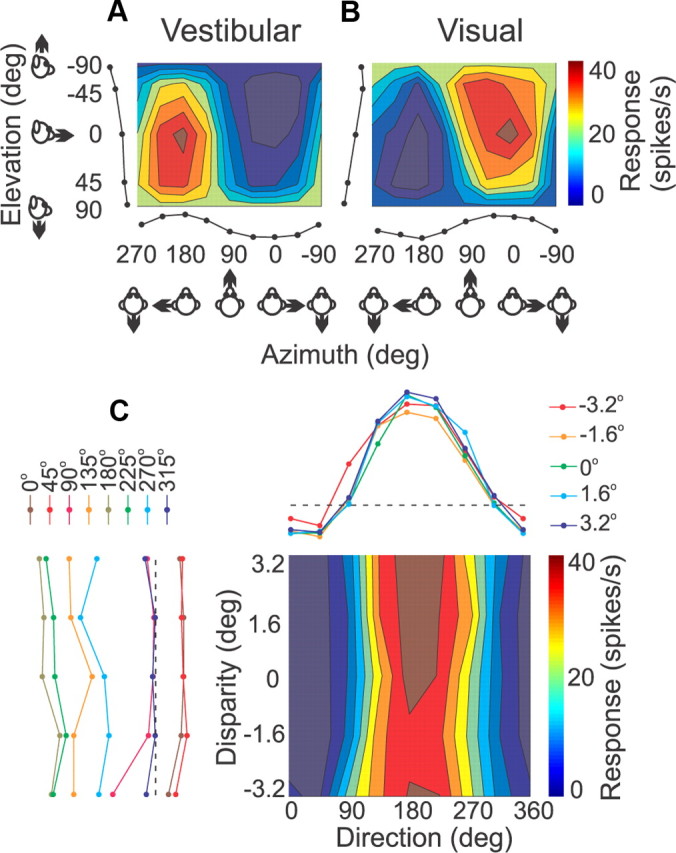
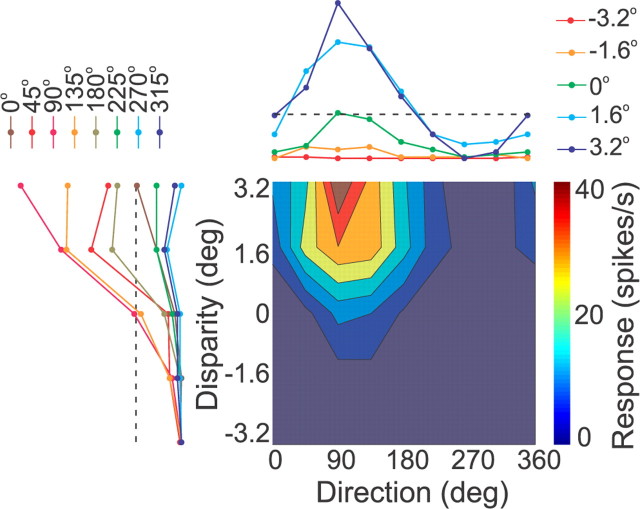
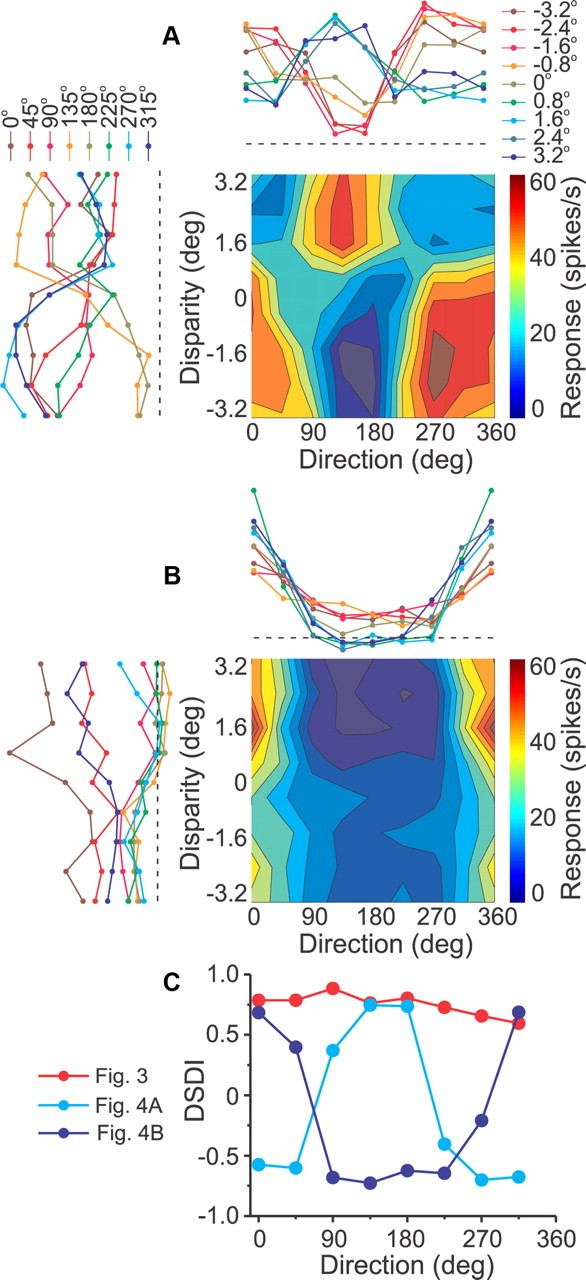
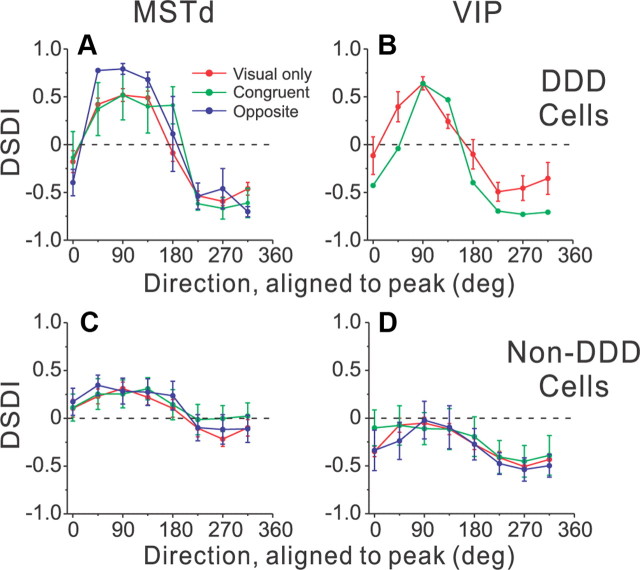
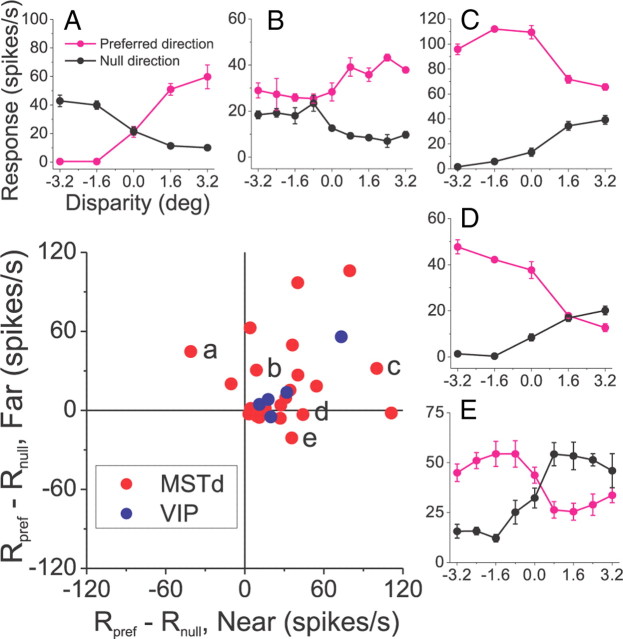
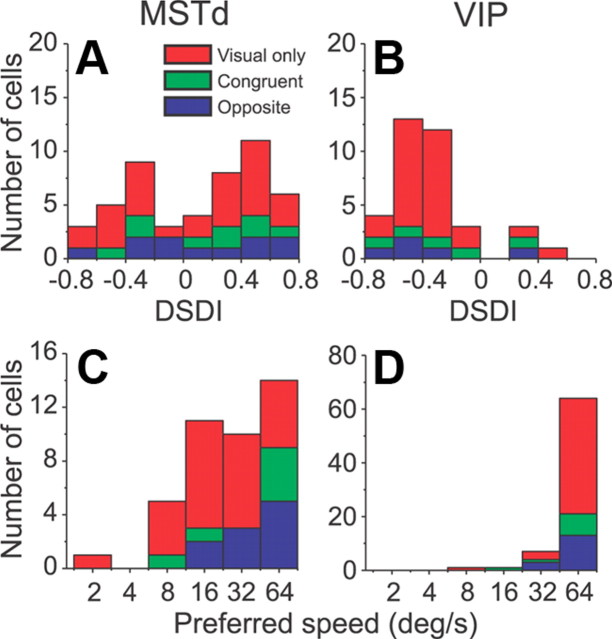
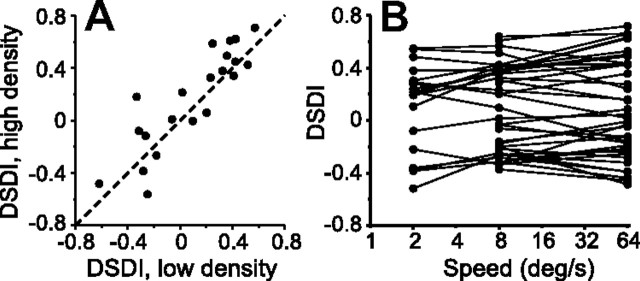
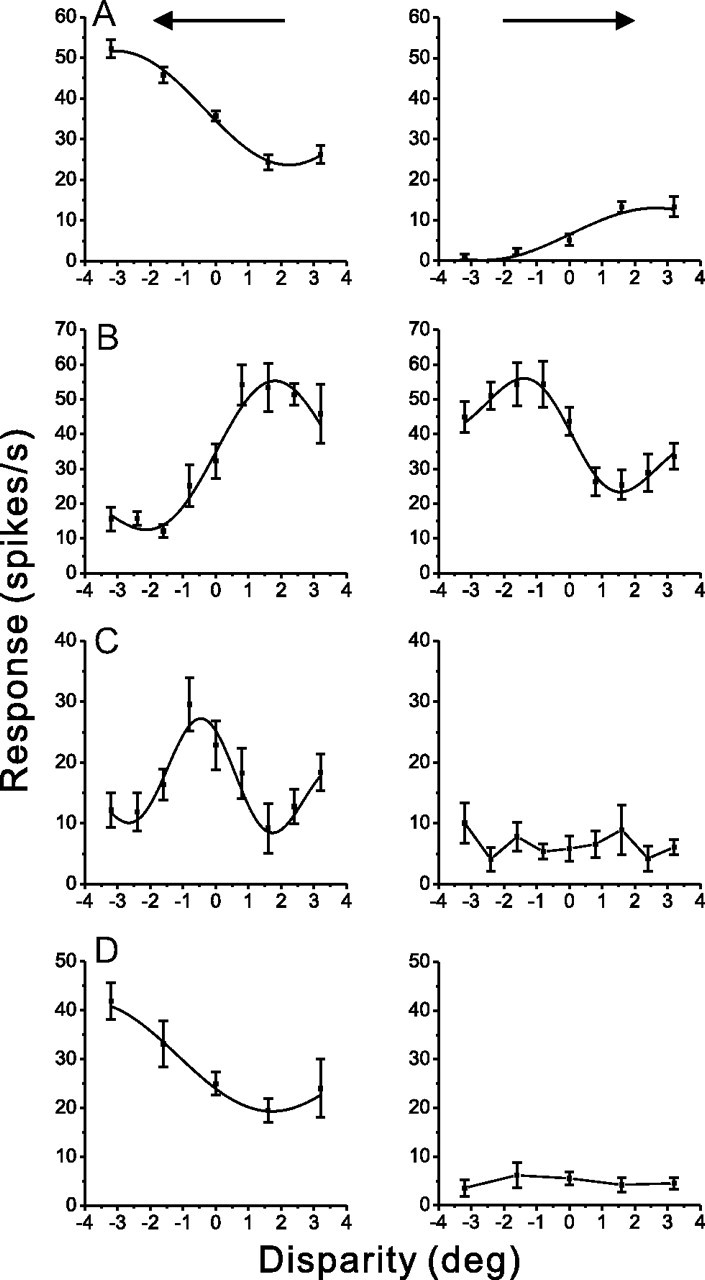
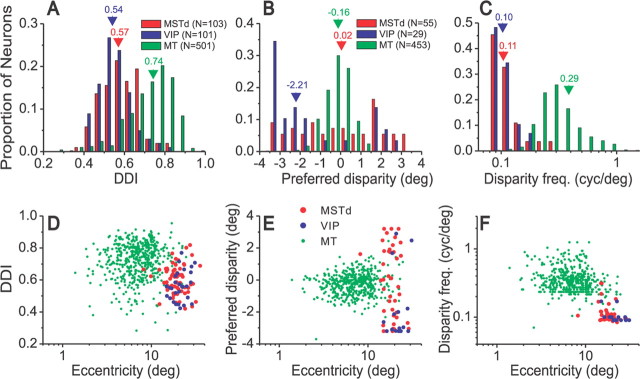
Many neurons in the dorsal medial superior temporal (MSTd) and ventral intraparietal (VIP) areas of the macaque brain are multisensory, responding to both optic flow and vestibular cues to self-motion. The heading tuning of visual and vestibular responses can be either congruent or opposite, but only congruent cells have been implicated in cue integration for heading perception. Because of the geometric properties of motion parallax, however, both congruent and opposite cells could be involved in coding self-motion when observers fixate a world-fixed target during translation, if congruent cells prefer near disparities and opposite cells prefer far disparities. We characterized the binocular disparity selectivity and heading tuning of MSTd and VIP cells using random-dot stimuli. Most (70%) MSTd neurons were disparity selective with monotonic tuning, and there was no consistent relationship between depth preference and congruency of visual and vestibular heading tuning. One-third of disparity-selective MSTd cells reversed their depth preference for opposite directions of motion [direction-dependent disparity tuning (DDD)], but most of these cells were unisensory with no tuning for vestibular stimuli. Inconsistent with previous reports, the direction preferences of most DDD neurons do not reverse with disparity. By comparison to MSTd, VIP contains fewer disparity-selective neurons (41%) and very few DDD cells. On average, VIP neurons also preferred higher speeds and nearer disparities than MSTd cells. Our findings are inconsistent with the hypothesis that visual/vestibular congruency is linked to depth preference, and also suggest that DDD cells are not involved in multisensory integration for heading perception.
Figures
Similar articles
-
Evidence for a Causal Contribution of Macaque Vestibular, But Not Intraparietal, Cortex to Heading Perception.J Neurosci. 2016 Mar 30;36(13):3789-98. doi: 10.1523/JNEUROSCI.2485-15.2016. J Neurosci. 2016. PMID: 27030763 Free PMC article.
-
Representation of vestibular and visual cues to self-motion in ventral intraparietal cortex.J Neurosci. 2011 Aug 17;31(33):12036-52. doi: 10.1523/JNEUROSCI.0395-11.2011. J Neurosci. 2011. PMID: 21849564 Free PMC article.
-
Convergence of vestibular and visual self-motion signals in an area of the posterior sylvian fissure.J Neurosci. 2011 Aug 10;31(32):11617-27. doi: 10.1523/JNEUROSCI.1266-11.2011. J Neurosci. 2011. PMID: 21832191 Free PMC article.
-
Visual and vestibular cue integration for heading perception in extrastriate visual cortex.J Physiol. 2011 Feb 15;589(Pt 4):825-33. doi: 10.1113/jphysiol.2010.194720. Epub 2010 Aug 2. J Physiol. 2011. PMID: 20679353 Free PMC article. Review.
-
Applying the efficient coding principle to understand encoding of multisensory and multimodality sensory signals.Vision Res. 2025 Jan;226:108489. doi: 10.1016/j.visres.2024.108489. Epub 2024 Nov 26. Vision Res. 2025. PMID: 39603079 Review.
Cited by
-
Evidence for a Causal Contribution of Macaque Vestibular, But Not Intraparietal, Cortex to Heading Perception.J Neurosci. 2016 Mar 30;36(13):3789-98. doi: 10.1523/JNEUROSCI.2485-15.2016. J Neurosci. 2016. PMID: 27030763 Free PMC article.
-
Simulating the cortical 3D visuomotor transformation of reach depth.PLoS One. 2012;7(7):e41241. doi: 10.1371/journal.pone.0041241. Epub 2012 Jul 16. PLoS One. 2012. PMID: 22815979 Free PMC article.
-
Coding of egocentric distance in the macaque ventral intraparietal area.iScience. 2025 Feb 10;28(3):111993. doi: 10.1016/j.isci.2025.111993. eCollection 2025 Mar 21. iScience. 2025. PMID: 40060902 Free PMC article.
-
Interdigitated Columnar Representation of Personal Space and Visual Space in Human Parietal Cortex.J Neurosci. 2022 Nov 30;42(48):9011-9029. doi: 10.1523/JNEUROSCI.0516-22.2022. Epub 2022 Oct 5. J Neurosci. 2022. PMID: 36198501 Free PMC article.
-
Neurons in Primate Area MSTd Signal Eye Movement Direction Inferred from Dynamic Perspective Cues in Optic Flow.J Neurosci. 2023 Mar 15;43(11):1888-1904. doi: 10.1523/JNEUROSCI.1885-22.2023. Epub 2023 Feb 1. J Neurosci. 2023. PMID: 36725323 Free PMC article.
References
-
- Angelaki DE, Cullen KE. Vestibular system: the many facets of a multimodal sense. Annu Rev Neurosci. 2008;31:125–150. - PubMed
-
- Bremmer F, Kubischik M, Pekel M, Lappe M, Hoffmann KP. Linear vestibular self-motion signals in monkey medial superior temporal area. Ann N Y Acad Sci. 1999;871:272–281. - PubMed
-
- Bremmer F, Klam F, Duhamel JR, Ben Hamed S, Graf W. Visual-vestibular interactive responses in the macaque ventral intraparietal area (VIP) Eur J Neurosci. 2002;16:1569–1586. - PubMed
Publication types
MeSH terms
Grants and funding
LinkOut - more resources
Full Text Sources
Research Materials