. 2011 Dec 7;31(49):17955-70.
doi: 10.1523/JNEUROSCI.2644-11.2011.

Cholinergic control in developing prefrontal-hippocampal networks

Affiliations

Cholinergic control in developing prefrontal-hippocampal networks

P Christoph Janiesch et al. J Neurosci. .

Abstract

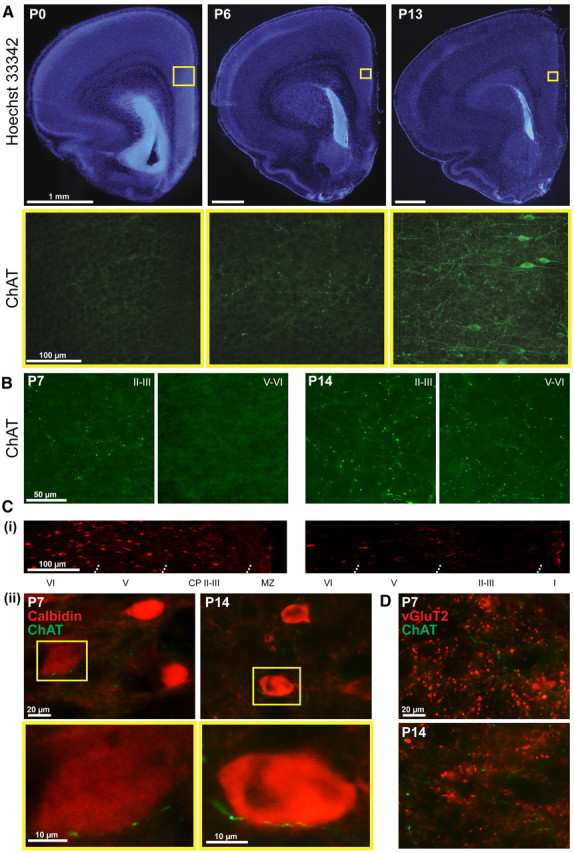
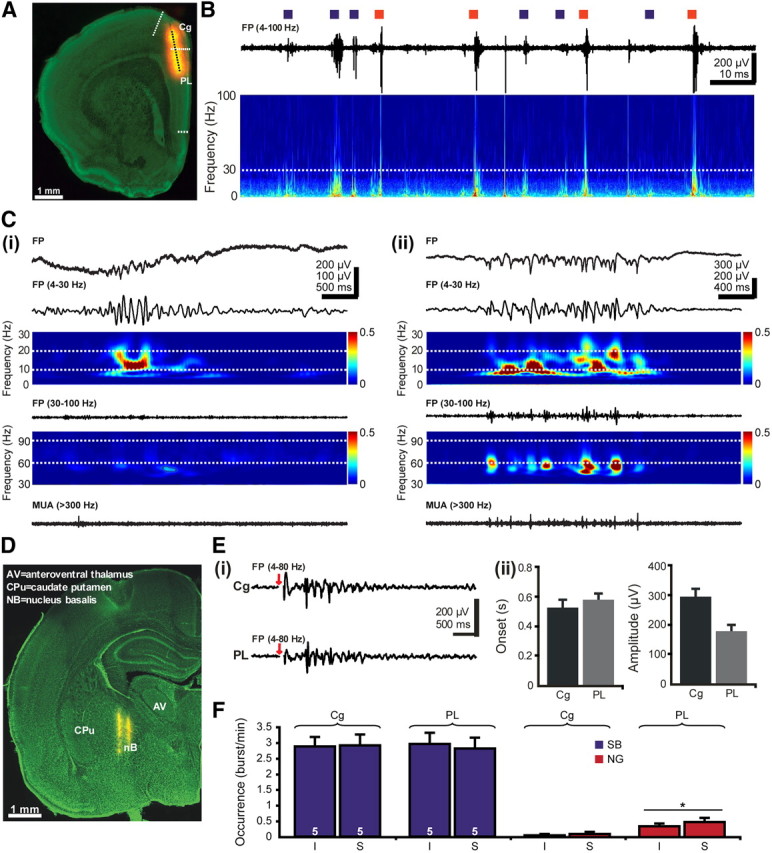
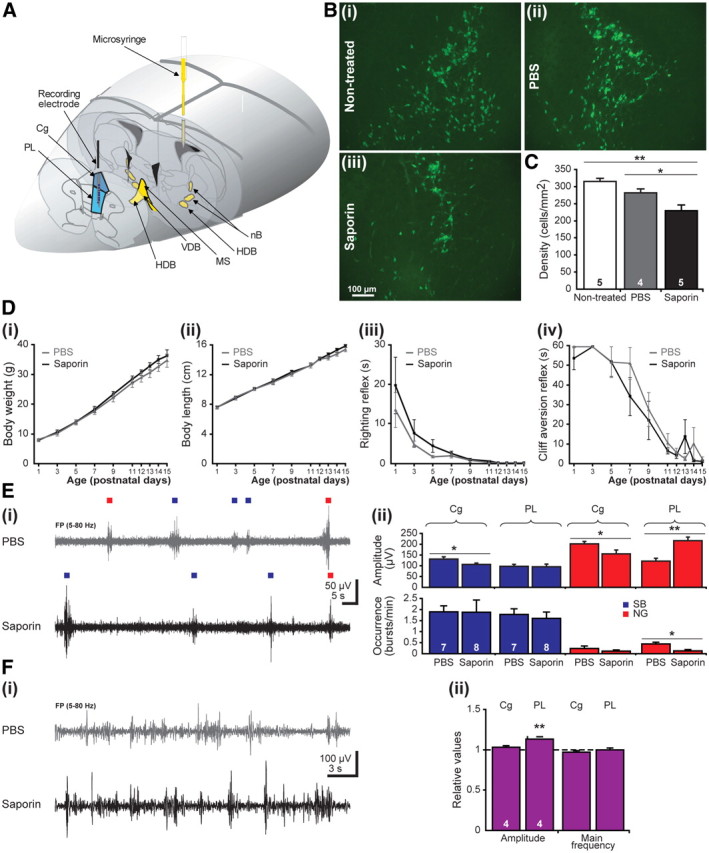
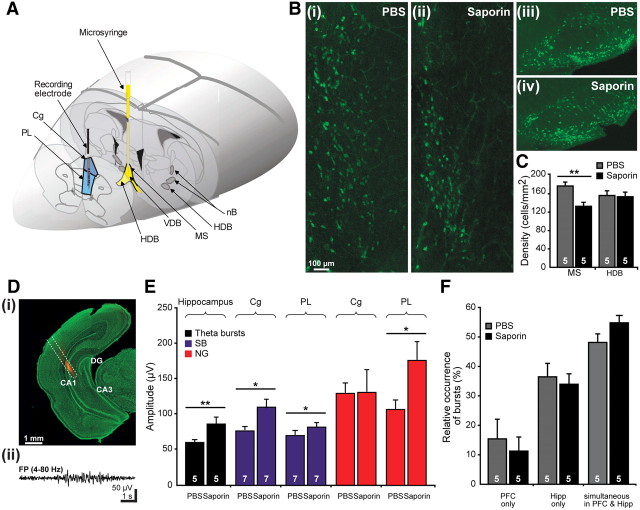
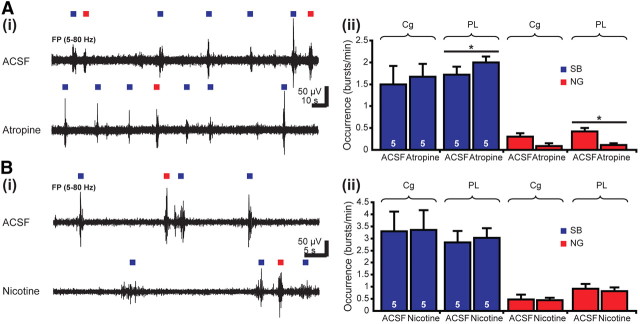
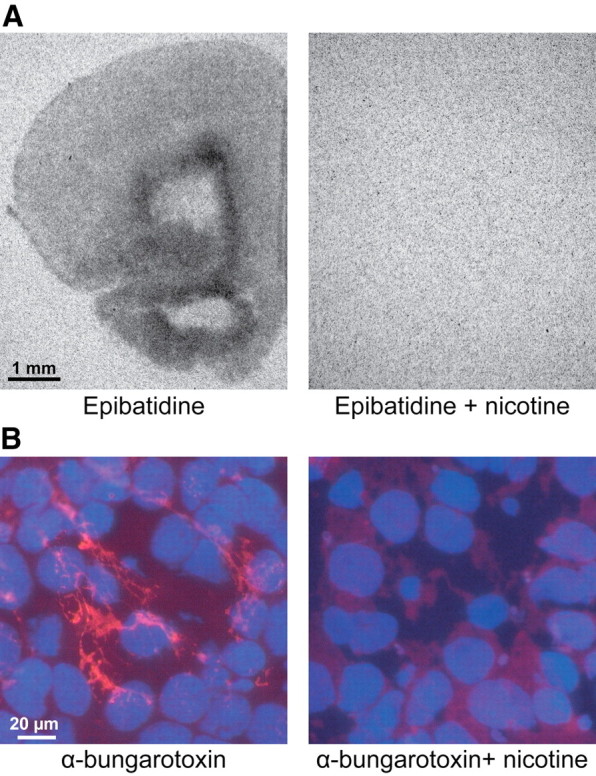
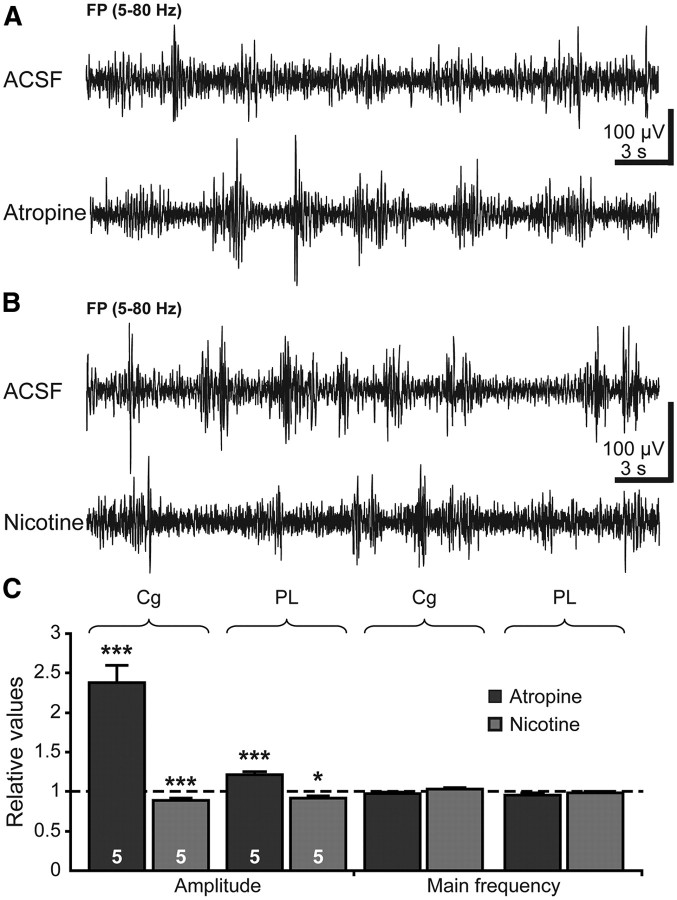
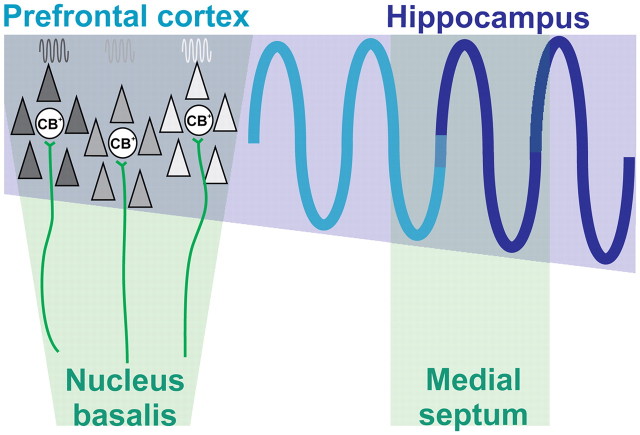
The cholinergic drive enhances input processing in attentional and mnemonic context by interacting with the activity of prefrontal-hippocampal networks. During development, acetylcholine modulates neuronal proliferation, differentiation, and synaptic plasticity, yet its contribution to the maturation of cognitive processing resulting from early entrainment of neuronal networks in oscillatory rhythms remains widely unknown. Here we show that cholinergic projections growing into the rat prefrontal cortex (PFC) toward the end of the first postnatal week boost the generation of nested gamma oscillations superimposed on discontinuous spindle bursts by acting on functional muscarinic but not nicotinic receptors. Although electrical stimulation of cholinergic nuclei increased the occurrence of nested gamma spindle bursts by 41%, diminishment of the cholinergic input by either blockade of the receptors or chronic immunotoxic lesion had the opposite effect. This activation of locally generated gamma episodes by direct cholinergic projections to the PFC was accompanied by indirect modulation of underlying spindle bursts via cholinergic control of hippocampal theta activity. With ongoing maturation and switch of network activity from discontinuous bursts to continuous theta-gamma rhythms, accumulating cholinergic projections acting on both muscarinic and nicotinic receptors mediated the transition from high-amplitude slow to low-amplitude fast rhythms in the PFC. By exerting multiple actions on the oscillatory entrainment of developing prefrontal-hippocampal networks, the cholinergic input may refine them for later gating processing in executive and mnemonic tasks.


Figures

Figure 1.
Figure 1.
Developmental profile of ingrowing cholinergic projections into the neonatal and prejuvenile PFC. A, Nuclear Hoechst 33342 (blue, top row) combined with immunofluorescent ChAT staining (green, bottom row) of 100-μm-thick coronal sections from P0, P6, and P13 rats, respectively. Note the absence of ChAT-positive projections in the PFC at birth, their densification with age, and the presence of prefrontal cholinergic cells toward the end of the second postnatal week. Yellow squares in the top row correspond to the prefrontal area at the border of the Cg and PL that is shown below for ChAT staining. B, Density of the ChAT fibers in the CP and layers II/III as well as in layers V/VI at the end of the first and second postnatal week. C, Relationship between cholinergic projections and CB-positive GABAergic neurons in the neonatal and prejuvenile PFC. Ci, Distribution of CB-positive GABAergic neurons over the PFC depth at P7 and P14. MZ, Marginal zone. Cii, Double staining of ChAT projections (green) and CB-positive neurons (red) at P7 and P14. CB-positive neurons contacted by cholinergic projections are depicted in the bottom row at higher magnification. D, Relationship between cholinergic projections and glutamatergic neurons in the neonatal and prejuvenile PFC. Double staining of ChAT projections (green) and vGluT2 (red) at P7 and P14.
Figure 2.
Figure 2.
Effects of cholinergic activation on the patterns of network activity in the neonatal PFC. A, Digital photomontage reconstructing the location of the DiI-covered recording electrode (orange) in the PFC of a Nissl-stained 50-μm-thick coronal section (green) from a P7 rat. Blue dots mark the 16 recording sites covering the cingulate and the prelimbic areas of the PFC. B, Extracellular FP recording of the intermittent oscillatory activity in the PFC of a P7 rat. Blue squares mark the SB, whereas red squares correspond to NG. The trace is accompanied by the “whitened” spectrogram of FP at identical timescale. The white dotted line marks the lower border of gamma frequency band (30 Hz). Note the wider frequency distribution for NG than for SB. Ci, Characteristic SB displayed before (top) and after bandpass (4–30 and 30–100 Hz) filtering (middle) and the corresponding MUA after 300 Hz high-pass filtering. Note the low spike discharge during SB. Color-coded frequency plots shows the wavelet spectrum of the FP with a mean frequency in alpha band and without detectable gamma activity. Cii, Characteristic NG displayed before (top) and after bandpass (4–30 and 30–100 Hz) filtering (middle) and the corresponding MUA after 300 Hz high-pass filtering. Note the presence of prominent gamma episodes that are accompanied by spike discharge. The top color-coded wavelet spectrum reveals the main frequency of NG within the theta–alpha band, whereas the NG episodes appear as periodic high-power spots on the bottom wavelet. D, Digital photomontage reconstructing the location of DiI-covered bipolar stimulation electrode (yellow) in a 100-μm-thick Nissl-stained coronal section, including the nB. Ei, Examples of SB elicited in the Cg and PL by single electrical stimulation of the nB. Red arrows mark the electrical stimulus. Stimulus artifacts were removed. Eii, Properties of SB evoked in the Cg and PL after single stimulation of the nB. Bar diagrams depict the similar onset (left) and the significantly (p < 0.05) different amplitude (right) of evoked oscillations in the two prefrontal areas. F, Bar diagram displaying the occurrence of SB and NG in the Cg and PL of five P7–P8 pups after electrode insertion (I) and tetanic stimulation of the nB (S).
Figure 3.
Figure 3.
Consequences of global cholinergic depletion by SAP on the prefrontal network activity and the developmental milestones of rat pups. A, Scheme of experimental setup for recording the PFC (blue) and impairing all cholinergic nuclei by intracerebroventricular injection of SAP (yellow) at P0. B, Immunohistochemistry of ChAT-positive neurons of nontreated (i), PBS-treated (ii), and SAP-treated (iii) pups. The pups were intracerebroventricularly injected at P0 and investigated at P7. Note the decreased number of cholinergic neurons in SAP-treated pups when compared with nontreated or PBS-treated rats. C, Bar diagram displaying the density of ChAT-positive neurons under nontreated conditions (white), after PBS treatment (gray), and after SAP lesion (black). The number of investigated pups is marked on the corresponding bar. D, Developmental profile of somatic growth [body weight (i), body length (ii)] and reflexes [righting reflex (iii), cliff aversion reflex (iv)] in PBS-treated (gray) and SAP-treated (black) pups. E, Consequence of SAP treatment on the prefrontal patterns of neonatal activity. Ei, Extracellular FP recordings from the PL of a P7 PBS-treated pup (gray) and a P7 SAP-treated pup (black). Blue and red squares differentiate between SB and NG. Eii, Bar diagram displaying the mean amplitude (top) and occurrence (bottom) of SB (blue) and NG (red) in the Cg and PL of seven PBS-treated and eight SAP-treated pups. Fi, Extracellular FP recordings from the PL of a P14 PBS-treated pup (gray) and a P14 SAP-treated pup (black). Fii, Bar diagram displaying the amplitude and mean frequency of continuous activity in the Cg and PL of four SAP-lesioned pups normalized to the properties of PBS-treated pups (dotted line).
Figure 4.
Figure 4.
Consequences of selective immunotoxic lesion of the cholinergic MS on the activity patterns within the prefrontal-hippocampal network. A, Scheme of experimental setup for recording the PFC (blue) and impairing some cholinergic nuclei (yellow). The spared cholinergic nuclei are marked in dark gray. B, Immunohistochemistry of ChAT-positive neurons in the MS (i, ii) and in the HDB (iii, iv) of PBS-treated (i, iii), and SAP-treated (ii, iv) pups. The pups were injected at P0 and investigated at P7. Note the decreased number of cholinergic neurons in the MS but not HDB of SAP-treated pups when compared with PBS-treated rats. C, Bar diagram displaying the density of ChAT-positive neurons in the MS and HDB of five PBS-treated (gray) and five SAP-lesioned (black) pups. Di, Digital photomontage reconstructing the location of the DiI-covered recording electrode (orange) in the intermediate Hipp of a Nissl-stained 50-μm-thick coronal section (green) from a P7 rat. Dii, Characteristic theta burst recorded in the CA1 area of the intermediate Hipp of a P7 rat and displayed after bandpass filtering (4–80 Hz). E, Consequences of SAP treatment on the prefrontal and hippocampal patterns of neonatal activity. Bar diagram displaying the mean amplitude of hippocampal theta bursts as well as of SB (blue) and NG (red) in the Cg and PL of PBS- and SAP-treated pups. The white numbers on the bars correspond to the number of investigated pups. F, Effects of SAP treatment on the temporal coupling of hippocampal and prefrontal activity. Bar diagram displaying the relative occurrence of oscillatory events that are present either exclusively in the PFC or in the Hipp or simultaneously in both regions of PBS-treated (gray) and SAP-treated (black) pups.
Figure 5.
Figure 5.
Effects of acute pharmacological manipulations of mAChRs and nAChRs on the oscillatory activity of the neonatal PFC. A, Consequences of local mAChRs blockade on SB (blue) and NG (red) in the Cg and PL. Ai, Extracellular FP recordings from the PL of a P7 rat before (ACSF, top trace) and after (bottom trace) intracortical injection of atropine. Blue and red squares differentiate between SB and NG. Aii, Bar diagram displaying the occurrence of SB and NG in the Cg and PL under control conditions (ACSF) and after atropine application in five P7–P8 rats. B, Consequences of local nAChRs activation on SB (blue) and NG (red) in the Cg and PL. Bi, Extracellular FP recordings from the PL of a P7 rat before (ACSF, top trace) and after (bottom trace) intracortical injection of nicotine. Bii, Bar diagram displaying the occurrence of SB and NG in the Cg and PL under control conditions (ACSF) and after nicotine application in five P7–P8 rats.
Figure 6.
Figure 6.
Presence of functional mAChRs and nAChRs in the neonatal PFC of the rat. A, Autoradiographs of α4β2 nAChRs using radiolabeled epibatidine obtained from a 20-μm-thick coronal section of a P6 rat in the presence (right) and absence (left) of nicotine. Note the dense presence of α4β2 nAChRs in the deeper layers of the PFC and the absence of binding when nicotine was added. B, Fluorescent staining of α7 nAChRs in a 20-μm-thick coronal section of a P6 pup using Alexa Fluor-555-labeled α-bungarotoxin. Note the prominent staining (red) of α7 nAChRs in layer II of the PL.
Figure 7.
Figure 7.
Effects of acute pharmacological manipulations of mAChRs and nAChRs on the oscillatory activity of the prejuvenile PFC. A, Consequences of local mAChR blockade on the continuous theta–gamma oscillations in the Cg and PL. Extracellular FP recordings from the PL of a P14 rat before (ACSF, top trace) and after (bottom trace) intracortical injection of atropine. Note the higher amplitude of theta oscillations in the presence of atropine. B, Consequences of local nAChR activation on continuous theta–gamma oscillations of the Cg and PL. Extracellular FP recordings from the PL of a P14 rat before (ACSF, top trace) and after (bottom trace) intracortical injection of nicotine. C, Bar diagram displaying the amplitude and main frequency of continuous oscillations in the Cg and PL of five atropine-treated (black) and five nicotine-treated (gray) pups normalized to the properties of oscillations after ACSF injection (dotted line).
Figure 8.
Figure 8.
Summary diagram displaying the interactions within the prefrontal–hippocampal network when modulated by subcortical cholinergic nuclei. Cholinergic input (green) from the MS modulates the amplitude of theta drive (blue sine wave) from the Hipp to the PFC. Additionally, cholinergic projections (green) from the nB directly boost the gamma entrainment of local networks in the PFC (dark gray, light gray, white) by acting mainly on CB-positive (CB+) neurons.

Similar articles

Cited by

References

    1. Alleva E, Caprioli A, Laviola G. Litter gender composition affects maternal behavior of the primiparous mouse dam (Mus musculus) J Comp Psychol. 1989;103:83–87. - PubMed
    1. Alonso A, Khateb A, Fort P, Jones BE, Mühlethaler M. Differential oscillatory properties of cholinergic and noncholinergic nucleus basalis neurons in guinea pig brain slice. Eur J Neurosci. 1996;8:169–182. - PubMed
    1. Armitage AK, Hall GH, Sellers CM. Effects of nicotine on electrocortical activity and acetylcholine release from the cat cerebral cortex. Br J Pharmacol. 1969;35:152–160. - PMC - PubMed
    1. Arters J, Hohmann CF, Mills J, Olaghere O, Berger-Sweeney J. Sexually dimorphic responses to neonatal basal forebrain lesions in mice. I. Behavior and neurochemistry. J Neurobiol. 1998;37:582–594. - PubMed
    1. Ashwell K W, Paxinos G. Atlas of the developing rat nervous system. Ed 3. San Diego: Elsevier Academic; 2008.

Publication types

MeSH terms

LinkOut - more resources