. 2011 Dec 7;31(49):17982-95.
doi: 10.1523/JNEUROSCI.2250-11.2011.

Iron and iron regulatory proteins in amoeboid microglial cells are linked to oligodendrocyte death in hypoxic neonatal rat periventricular white matter through production of proinflammatory cytokines and reactive oxygen/nitrogen species

Affiliations

Iron and iron regulatory proteins in amoeboid microglial cells are linked to oligodendrocyte death in hypoxic neonatal rat periventricular white matter through production of proinflammatory cytokines and reactive oxygen/nitrogen species

Gurugirijha Rathnasamy et al. J Neurosci. .

Abstract

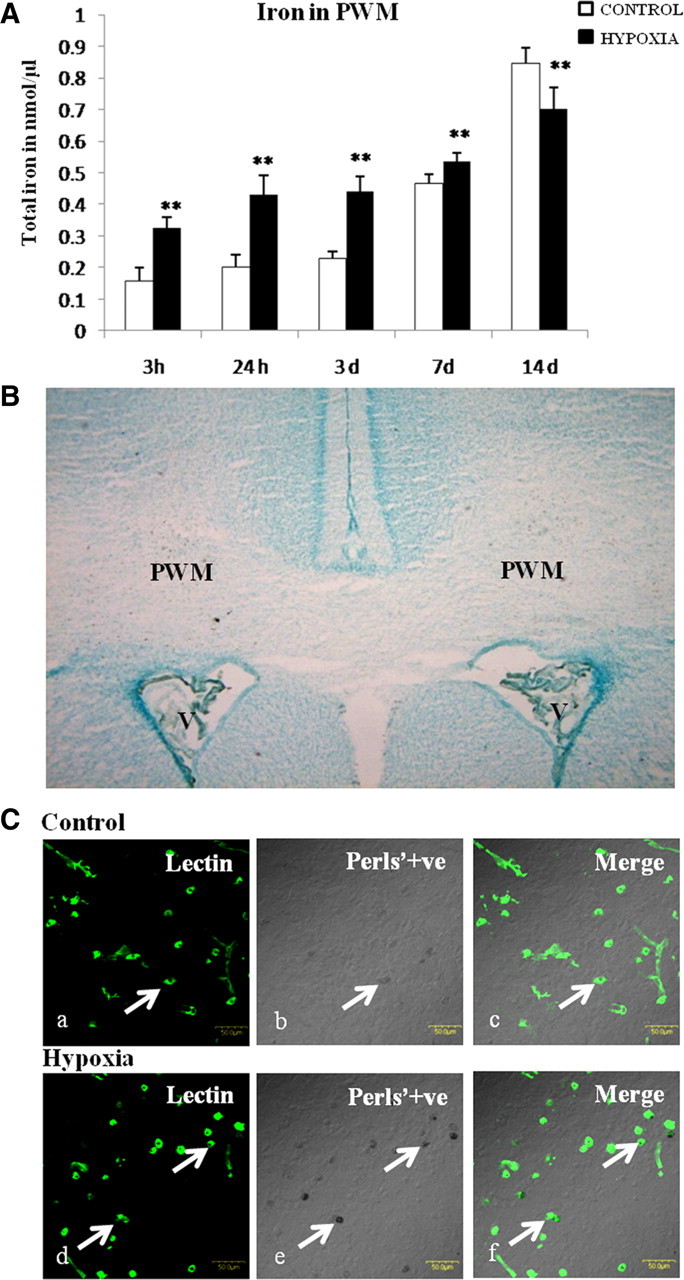
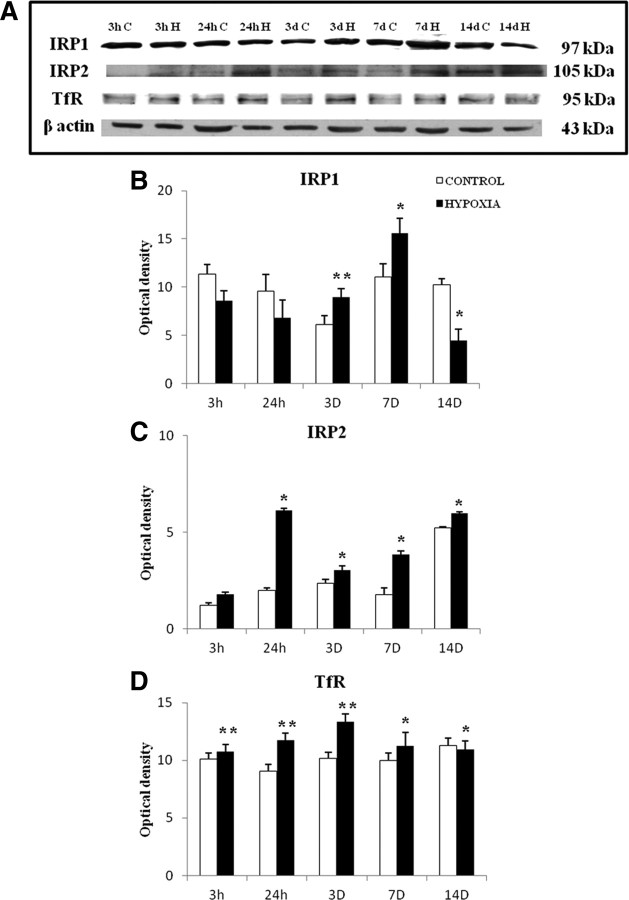
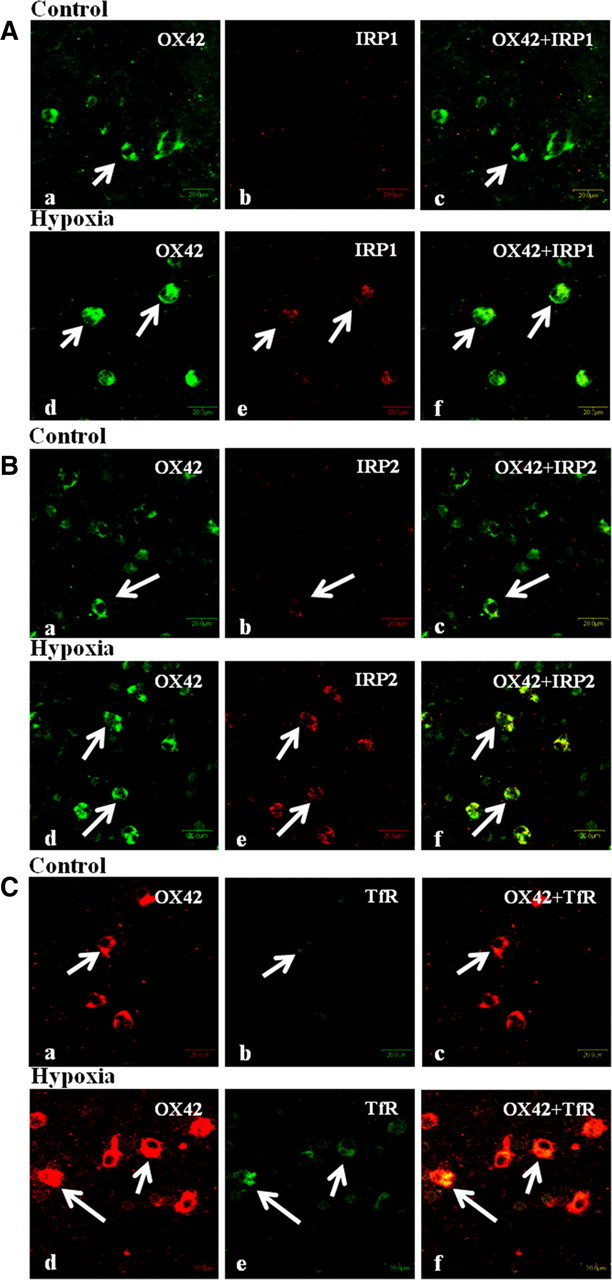
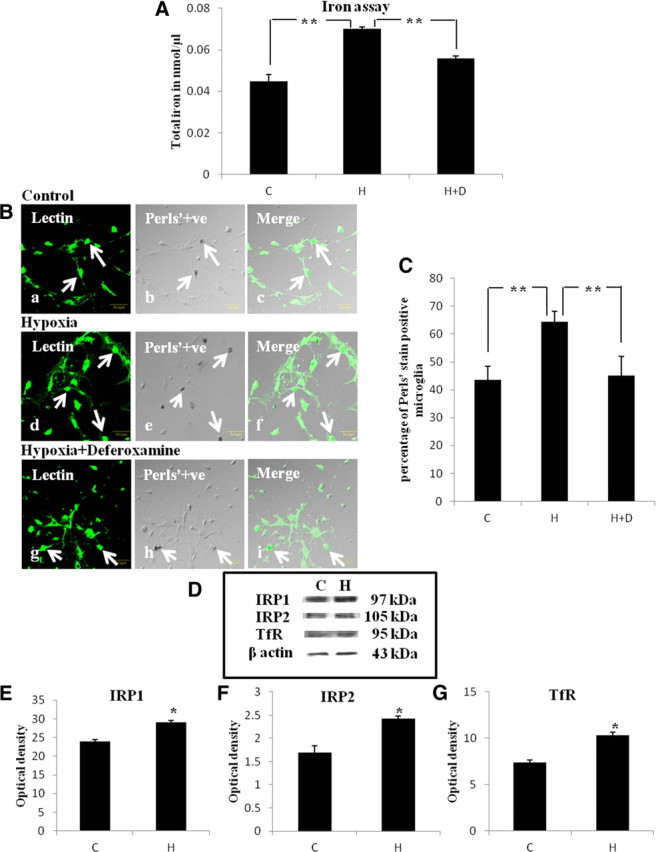
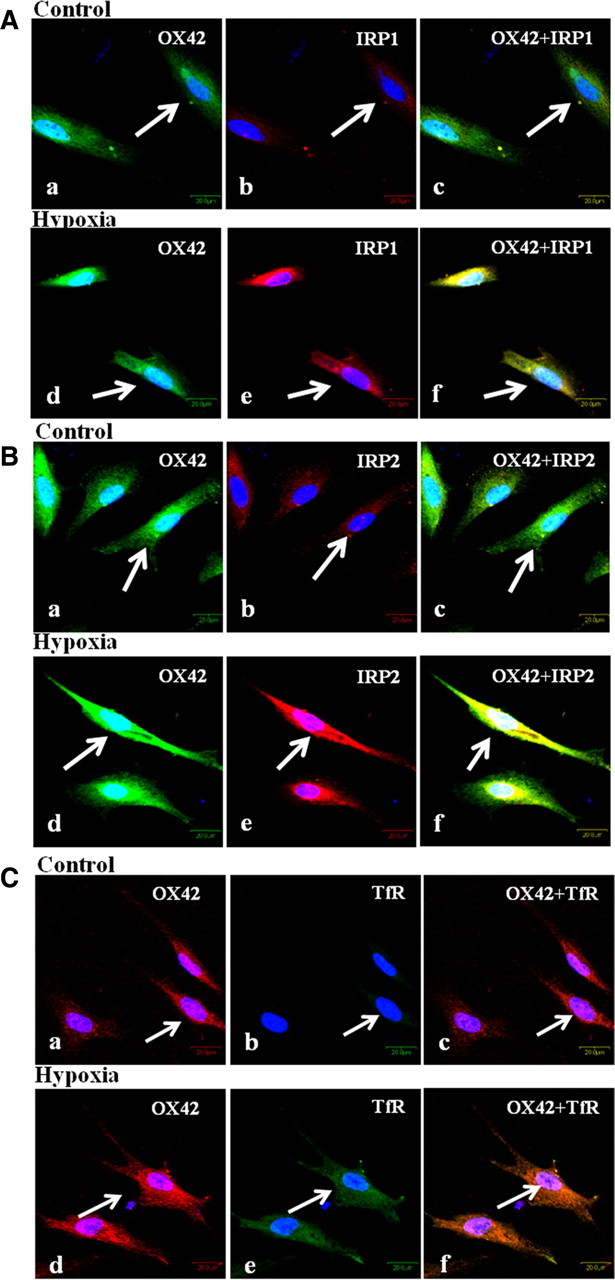
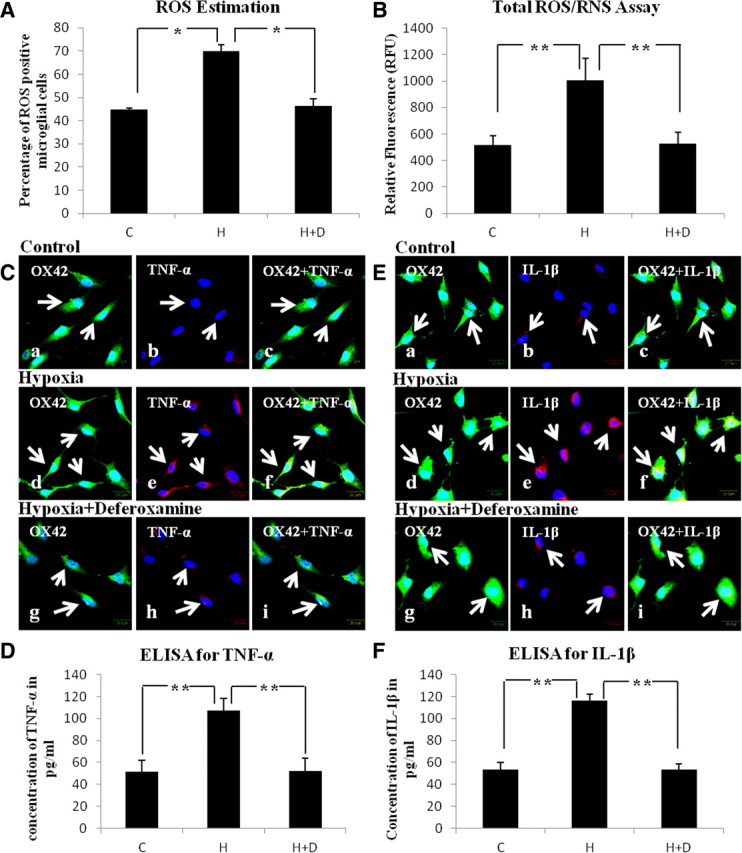
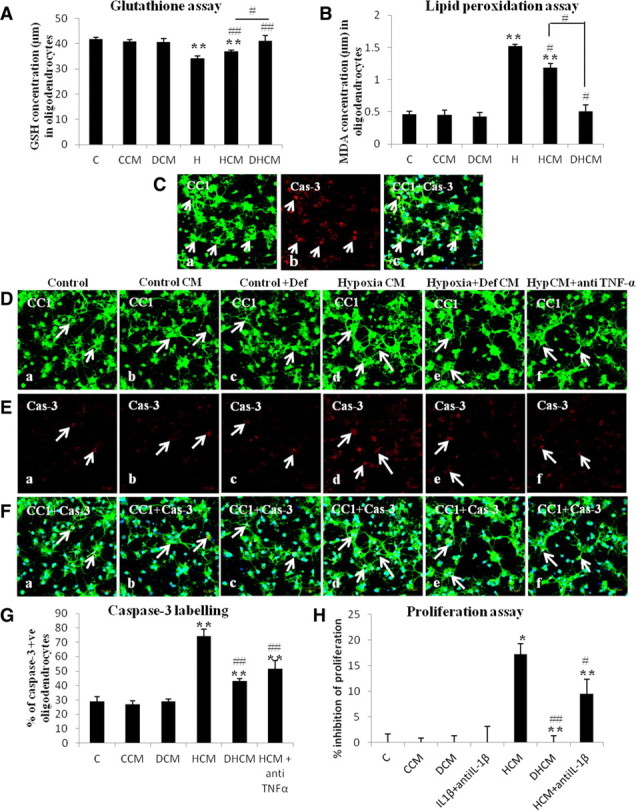
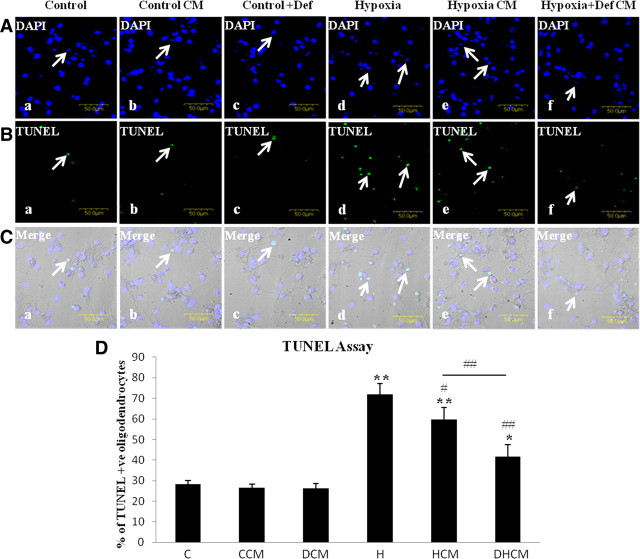
This study was aimed to examine the role of iron in causing periventricular white matter (PWM) damage following a hypoxic injury in the developing brain. Along with iron, the expression of iron regulatory proteins (IRPs) and transferrin receptor (TfR), which are involved in iron acquisition, was also examined in the PWM by subjecting 1-d-old Wistar rats to hypoxia. Apart from an increase in iron levels in PWM, Perls' iron staining showed an increase of intracellular iron in the preponderant amoeboid microglial cells (AMCs) in the tissue. In response to hypoxia, the protein levels of IRP1, IRP2, and TfR in PWM and AMCs were significantly increased. In primary microglial cultures, administration of iron chelator deferoxamine reduced the generation of iron-induced reactive oxygen and nitrogen species and proinflammatory cytokines such as tumor necrosis factor-α and interleukin-1β. Primary oligodendrocytes treated with conditioned medium from hypoxic microglia exhibited reduced glutathione levels, increased lipid peroxidation, upregulated caspase-3 expression, and reduced proliferation. This was reversed to control levels on treatment with conditioned medium from deferoxamine treated hypoxic microglia; also, there was reduction in apoptosis of oligodendrocytes. The present results suggest that excess iron derived primarily from AMCs might be a mediator of oligodendrocyte cell death in PWM following hypoxia in the neonatal brain.


Figures

Figure 1.
Figure 1.
A, Iron content in the PWM of postnatal rats at 3 and 24 h, 3, 7, and 14 d after hypoxic exposure and their corresponding controls. Significant differences in total iron level between hypoxic and control groups are expressed as **p < 0.01. B, Light-microscopic image of a brain section stained with Perls' solution and methyl green, showing the region of interest, PWM just peripheral to the lateral ventricles (V). C, Confocal images of Perls' iron-stained sections showing iron localization in the PWM at 3 d after hypoxic exposure and their corresponding controls. Distribution of lectin (marker for microglia) (Ca, Cd; green) and iron localization (Cb, Ce; black) is seen in AMCs (arrows) in the PWM in overlays Cc and Cf (merge). Scale bars, 50 μm. The experiments were performed in triplicate.
Figure 2.
Figure 2.
Western blot showing the protein expression of IRP1, IRP2, and TfR in the PWM of postnatal rats at 3 and 24 h, 3, 7, and 14 d after hypoxic exposure and their corresponding controls. A shows the immunoreactive bands of IRP1 (97 kDa), IRP2 (105 kDa), TfR (95 kDa), and β-actin (43 kDa). B–D are their corresponding bar graphs showing significant changes in the optical density following hypoxic exposure (given as mean ± SD). The experiment was repeated five times, and a representative blot is shown here. Significant differences in protein levels between hypoxic and control groups are expressed as follows: *p < 0.05; **p < 0.01.
Figure 3.
Figure 3.
Confocal images showing the expression of OX42, IRP1, IRP2, and TfR in the PWM at 3 d after hypoxic exposure (Ad–f, Bd–f, Cd–f) and their corresponding control (Aa–c, Ba–c, Ca–c). Expression of OX42 (A, Ba,d: green; Ca,d: red), IRP1 (Ab,e: red), IRP2 (Bb,e: red), TfR (Cb,e: green), and a colocalization of OX42 with IRP1, IRP2, and TfR (A–Cc,f). Scale bars: A–C, 20 μm. The experiment was repeated five times.
Figure 4.
Figure 4.
A, Bar graph in A shows significant changes in the total iron content in microglial culture. Note the reduction of iron in hypoxic microglial cells when treated with deferoxamine (H+D). Significant differences in total iron level between control (C), hypoxic (H), and deferoxamine treated groups are expressed as follows: *p < 0.05; **p < 0.01. B, Confocal images of Perls' iron-stained primary microglial cells in control, hypoxic, and deferoxamine (Hyp+Def)-treated hypoxic microglia. Distribution of lectin (a, d, g: green) and iron localization (b, e, h: black) is seen in microglia (arrows). Scale bars, 50 μm. C, Bar graph in C shows the significant changes in the percentage of microglia that are Perls' positive. Significant differences between the groups are expressed as follows: *p < 0.05; **p < 0.01. The experiment was repeated in triplicate. D, Western blot showing the protein expression of IRP1, IRP2, and TfR in the primary microglial culture. E–G are their corresponding bar graphs showing significant changes in the optical density between control (C) and hypoxia (H) (given as mean ± SD). Significant differences in protein levels between hypoxic and control groups are expressed as follows: *p < 0.05; **p < 0.01. The experiment was repeated five times.
Figure 5.
Figure 5.
Confocal images showing the colocalization of IRP1 (Ab,e: red), IRP2 (Bb,e: red), TfR (Cb,e: green), and OX42 (Aa,d, Ba,d: green; Ca,d: red) in primary microglial culture. Note the enhanced IRP1, IRP2, and TfR immunofluorescence intensity in the hypoxic microglia when compared with the corresponding control cells. The cells were subjected to 4 h of hypoxic exposure and processed immediately thereafter for immunolabeling. Scale bars, 20 μm. The experiment was repeated in triplicate.
Figure 6.
Figure 6.
A, Bar graph represents the intracellular ROS estimation using 10 μm CM-H2DCFDA in primary microglial cells. Note a marked increase in ROS level following hypoxia (H) for 4 h when compared with control (C). The hypoxia-induced increase in ROS is suppressed by ∼30% with deferoxamine (H+D) when compared with that of hypoxic microglia. B, Bar graph in B represents the total ROS/RNS released by control (C), hypoxia (H), and hypoxia + deferoxamine (H+D) microglia. C, Confocal images showing the colocalization of OX42 (a, d, g: green) and TNF-α (b, e, h: red) in control (C), hypoxia (H), and hypoxia + deferoxamine (H+D) microglia. Note enhanced TNF-α immunofluorescence is attenuated with deferoxamine treatment. The bar graph in D shows the concentration of TNF-α released into the medium by control (C), hypoxia (H), and hypoxia + deferoxamine (H+D) microglia. E, Confocal images showing the colocalization of OX42 (a, d, g: green) and IL-1β (b, e, h: red) in control (C), hypoxia (H), and hypoxia + deferoxamine (H+D) microglia. Note hypoxia enhanced IL-1β immunofluorescence is attenuated by deferoxamine. Bar graph in F shows the concentration of IL-1β released into the medium in control (C), hypoxia (H), and hypoxia + deferoxamine (H+D) microglia. Scale bars, 20 μm. Significant differences between the groups are expressed as follows: *p < 0.05; **p < 0.01. Each experiment was performed in triplicate.
Figure 7.
Figure 7.
A, Bar graph represents the glutathione content in primary oligodendrocytes in control group (C), oligodendrocytes treated with conditioned medium from control microglia (CCM), oligodendrocytes treated with deferoxamine (DCM), hypoxic oligodendrocytes (H), oligodendrocytes treated with conditioned medium from hypoxic microglia (HCM), and with conditioned medium from deferoxamine treated hypoxic microglial cells (DHCM). B, Bar graph represents the MDA concentrations in oligodendrocyte cultures in all six groups. Significant differences between the groups are expressed as follows: *p < 0.05, **p < 0.01 with respect to control; and #p < 0.05, ##p < 0.01 with respect to hypoxia. C, Confocal images showing caspase-3 (Cas-3)-positive oligodendrocytes on treatment with TNF-α [Ca, CC1 (green); Cb, Cas-3 (red); Cc, CC1 + Cas-3 + DAPI (blue)]. D–F, Caspase-3 labeling of oligodendrocytes showing a significant increase in cells treated with conditioned medium from hypoxic microglial cells. D shows the confocal images of CC1-stained oligodendrocytes in all groups, E shows the confocal images of cells that are caspase-3 positive in all groups, F shows the colocalization of CC1, caspase-3, and DAPI-positive cells (green, CC1; red, Cas-3; blue, DAPI). Scale bars, 50 μm. The bar graph in G shows the percentage of caspase-3-positive cells in all groups including HCM+ anti-TNF-α (treated with conditioned medium from hypoxic microglia containing 10 μg/ml anti-TNF-α). The bar graph in H represents the proliferation of oligodendrocytes in all groups including IL-1β + anti-IL-1β (treated with 100 pg/ml IL-1β peptide neutralized with 10 μg/ml anti-IL-1β) and HCM + anti-IL-1β (treated with conditioned medium from hypoxic microglia containing 10 μg/ml anti-IL-1β). See text for detailed description of changes. Significant differences between the various groups are expressed as follows: *p < 0.05, **p < 0.01 with respect to control; and #p < 0.05, ##p < 0.01 with respect to HCM. Each experiment was performed in triplicate.
Figure 8.
Figure 8.
TUNEL assay of oligodendrocytes showing a significant increase in apoptosis following hypoxia and on treatment with conditioned medium from microglial cells subjected to hypoxia. A shows the confocal images of DAPI-stained nucleus in all of the groups, B shows the confocal images of cells that are TUNEL positive in all of the groups, and C shows the colocalization of DAPI- and TUNEL-positive cells. Bar graph in D shows the percentage of cells that are TUNEL positive in each group (C, control; CCM, treated with conditioned medium control microglia; DCM, treated with deferoxamine; H, hypoxia; HCM, treated with conditioned medium from hypoxic microglia; DHCM, treated with conditioned medium from hypoxic microglial cells plus deferoxamine). Scale bars, 50 μm. Significant differences between the various groups are expressed as follows: *p < 0.05, **p < 0.01 with respect to control; and #p < 0.05, ##p < 0.01 with respect to hypoxia. The experiment was repeated in triplicate.

Similar articles

Cited by

References

    1. Adcock LM, Yamashita Y, Goddard-Finegold J, Smith CV. Cerebral hypoxia-ischemia increases microsomal iron in newborn piglets. Metab Brain Dis. 1996;11:359–367. - PubMed
    1. Armstrong RC. Isolation and characterization of immature oligodendrocyte lineage cells. Methods. 1998;16:282–292. - PubMed
    1. Armstrong RC, Aja T, Xiang J, Gaur S, Krebs JF, Hoang K, Bai X, Korsmeyer SJ, Karanewsky DS, Fritz LC, Tomaselli KJ. Fas-induced activation of the cell death-related protease CPP32 Is inhibited by Bcl-2 and by ICE family protease inhibitors. J Biol Chem. 1996;271:16850–16855. - PubMed
    1. Back SA, Gan X, Li Y, Rosenberg PA, Volpe JJ. Maturation-dependent vulnerability of oligodendrocytes to oxidative stress-induced death caused by glutathione depletion. J Neurosci. 1998;18:6241–6253. - PMC - PubMed
    1. Back SA, Han BH, Luo NL, Chricton CA, Xanthoudakis S, Tam J, Arvin KL, Holtzman DM. Selective vulnerability of late oligodendrocyte progenitors to hypoxia-ischemia. J Neurosci. 2002;22:455–463. - PMC - PubMed

Publication types

MeSH terms