. 2012 Mar 30;18(1):286-96.
doi: 10.2119/molmed.2011.00331.

Functional characterization of glycine N-methyltransferase and its interactive protein DEPDC6/DEPTOR in hepatocellular carcinoma

Affiliations

Functional characterization of glycine N-methyltransferase and its interactive protein DEPDC6/DEPTOR in hepatocellular carcinoma

Chia-Hung Yen et al. Mol Med. .

Erratum in

  • Mol Med. 2012;18(1):546

Abstract

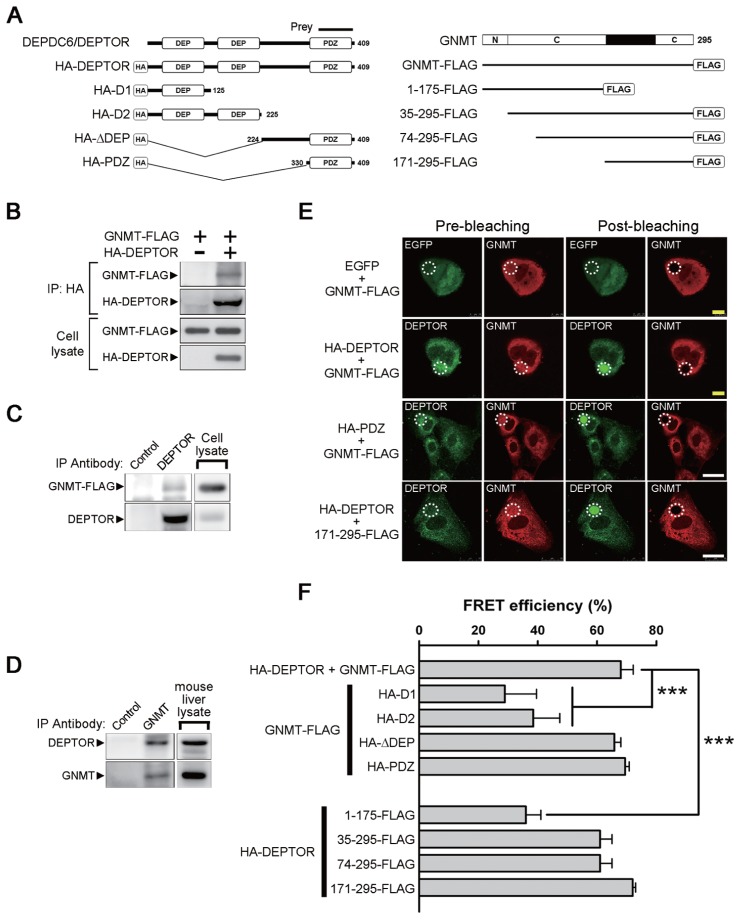
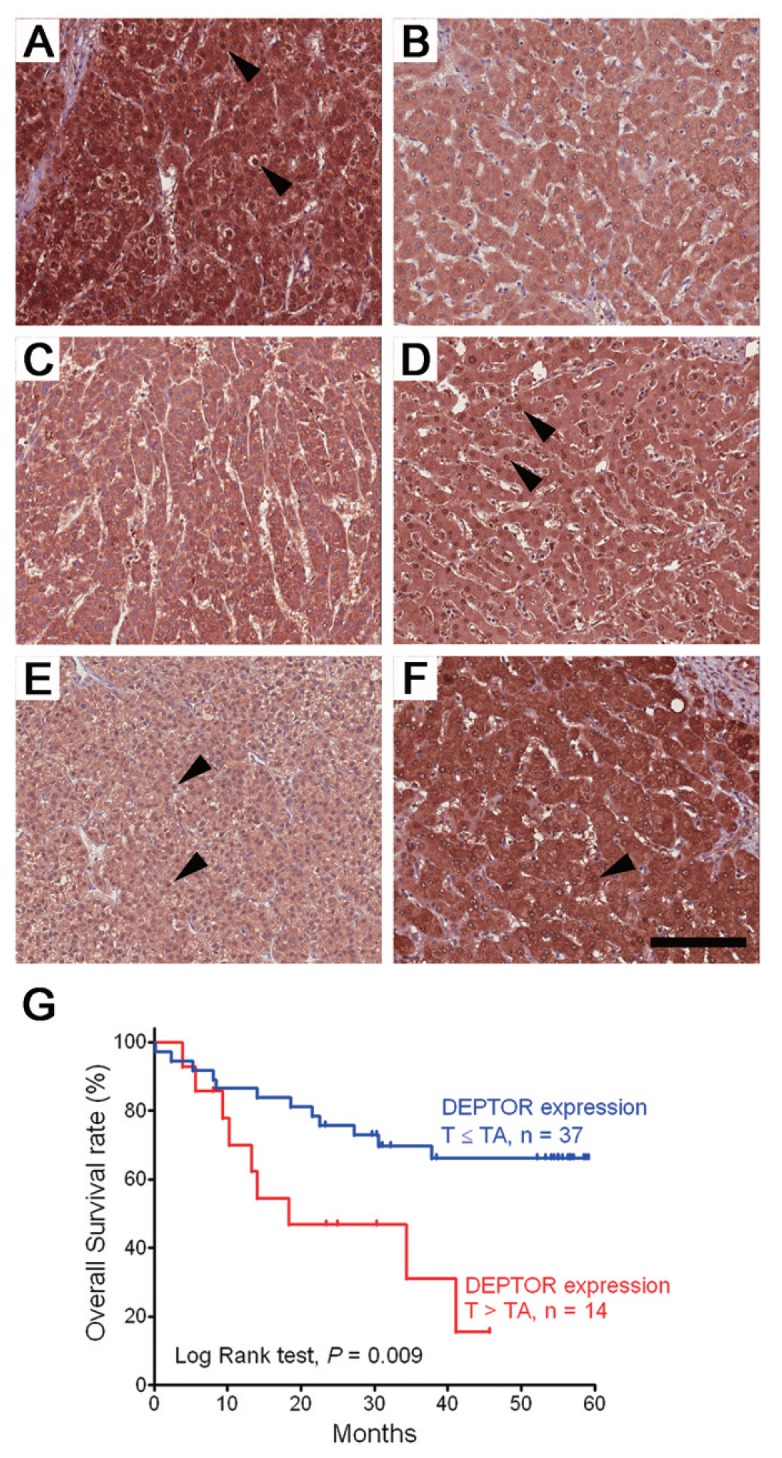
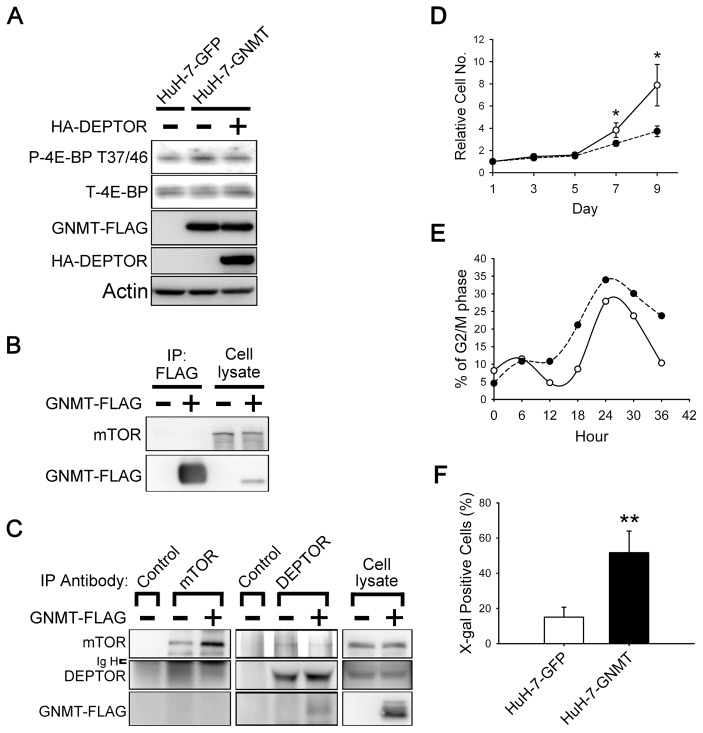
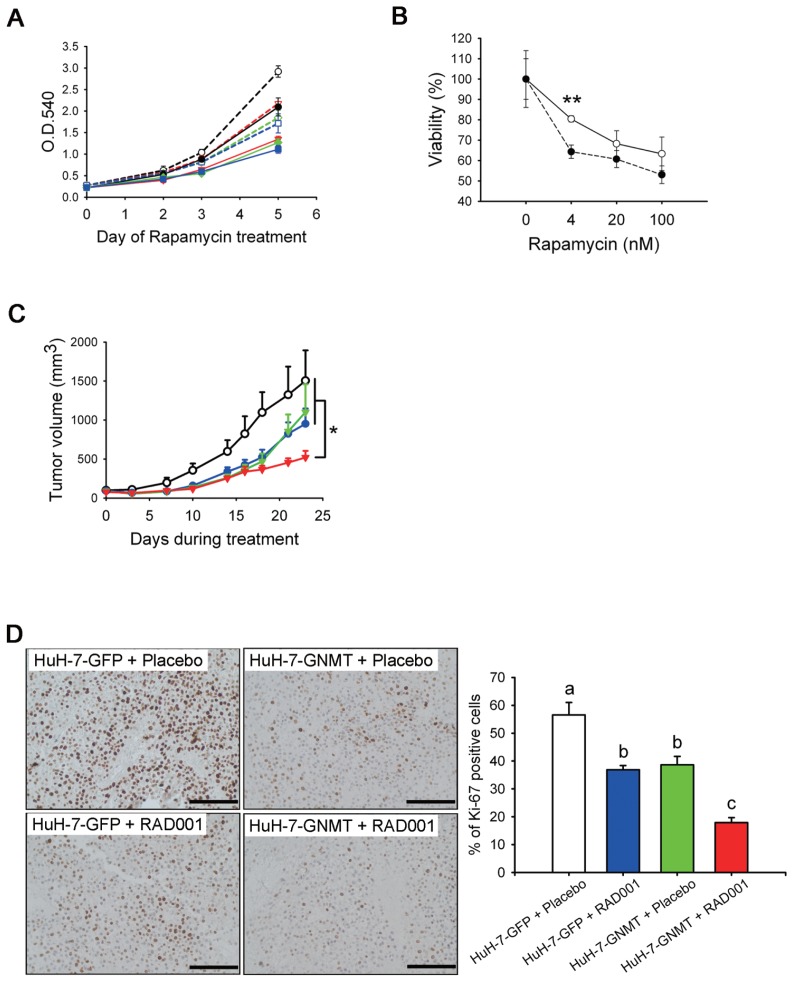
Glycine N-methyltransferase (GNMT) is a tumor suppressor for hepatocellular carcinoma (HCC). High rates of Gnmt knockout mice developed HCC. Epigenetic alteration and dysregulation of several pathways including wingless-type MMTV integration site (Wnt), mitogen-activated protein kinase (MAPK) and Janus kinase and signal transducer and activator of transcription (JAK-STAT) are associated with HCC development in Gnmt knockout mice. We hypothesized that GNMT may regulate signal transduction through interacting with other proteins directly. In this report, we identified a mammalian target of rapamycin (mTOR) inhibitor (DEP domain containing MTOR-interacting protein [DEPDC6/DEPTOR]) as a GNMT-binding protein by using yeast two-hybrid screening. Fluorescence resonance energy transfer assay demonstrated that the C-terminal half of GNMT interact with the PSD-95/Dlg1/ZO-1 (PDZ) domain of DEPDC6/DEPTOR. Immunohistochemical staining showed that 27.5% (14/51) of HCC patients had higher expression levels of DEPDC6/DEPTOR in the tumorous tissues than in tumor-adjacent tissues, especially among HCC patients with hepatitis B viral infection (odds ratio 10.3, 95% confidence interval [CI] 1.05-11.3) or patients with poor prognosis (death hazard ratio 4.51, 95% CI 1.60-12.7). In terms of molecular mechanism, knockdown of DEPDC6/DEPTOR expression in HuH-7 cells caused S6K and 4E-BP activation, but suppressed Akt. Overexpression of DEPDC6/DEPTOR activated Akt and increased survival of HCC cells. Overexpression of GNMT caused activation of mTOR/raptor downstream signaling and delayed G2/M cell cycle progression, which altogether resulted in cellular senescence. Furthermore, GNMT reduced proliferation of HuH-7 cells and sensitized them to rapamycin treatment both in vitro and in vivo. In conclusion, GNMT regulates HCC growth in part through interacting with DEPDC6/DEPTOR and modulating mTOR/raptor signaling pathway. Both GNMT and DEPDC6/DEPTOR are potential targets for developing therapeutics for HCC.


Figures

Figure 1
Figure 1
Identification of DEPDC6/DEPTOR as a GNMT binding protein and mapping of the interactive domains. (A) Different constructs of DEPDC6/DEPTOR and GNMT used for domain mapping. The protein fragment expressed by the positive prey clone obtained from a yeast two-hybrid screening was indicated. N, amino-terminal region of GNMT; C, catalytic domains located in amino acids 37–175 and 243–295 of GNMT. (B) FLAG-tagged GNMT coimmunoprecipitated with HA-tagged DEPTOR. HEK293T cells were transfected with the indicated plasmids and harvested for immunoprecipitation analysis. (C) Interaction of endogenous DEPTOR with FLAG-tagged GNMT. FLAG-tagged GNMTs were expressed in HuH-7 cells, and cell lysates were used for immunoprecipitation analysis. (D) Interaction of endogenous DEPTOR with endogenous GNMT. Mouse liver lysates were used for immunoprecipitation analysis. Each experiment was repeated at least three times. (E) FRET-AB assay was used to assess the interaction between GNMT and DEPTOR and to map their interactive domains. Photobleaching of the GNMT rhodamine label (white dotted circle) resulted in an increase of DEPTOR fluorescent signal within the photobleached area, thus demonstrating the FRET effects (yellow bar = 10 μm; white bar = 25 μm). Positive results were also observed in HuH-7 cells coexpressed in the PDZ domain of DEPTOR and GNMT-FLAG as well as in cells coexpressed in the HA-DEPTOR and C-terminal region (amino acids 171–295) of GNMT. (F) Quantitative results of FRET efficiency in different sets of FRET-AB assays. HuH-7 cells were transfected with the indicated plasmids and were subjected to FRET-AB assay. Data are presented as means ± SD of 5–10 random fields from two independent experiments. Some image data are shown in Supplementary Figure 2. ***P < 0.001. IP, immunoprecipitation.
Figure 2
Figure 2
Expression profiles of DEPTOR in human HCC and the association with survival. (A–F) IHC staining of DEPTOR in three pairs of tumorous (T) and tumor-adjacent (TA) tissues from 51 HCC patients. (A, C, E) Tumorous tissues. (B, D, F) Tumor-adjacent tissues. (A, B) An example of the T > TA staining pattern. (C, D) An example of the T = TA staining pattern. (E, F) An example of the T < TA staining pattern. Arrowheads indicate nuclear staining of DEPTOR (bar = 100 μm). (G) Kaplan-Meier survival curves of two groups of HCC patients with different DEPTOR expression patterns (T > TA versus T ≤ TA).
Figure 3
Figure 3
The effects of DEPTOR on mTOR signaling in HuH-7 cells. (A) Knockdown of DEPTOR resulted in activation of S6K and a decrease of Akt phosphorylation. HuH-7 cells were infected with lentiviruses expressing shRNAs targeting DEPTOR or luciferase (shLuc). Cell lysates were analyzed by Western blotting for indicated proteins and phosphorylation states. P and T indicate phosphorylated and total protein, respectively. (B) DEPTOR knockdown in HuH-7 cells led to a decrease in proliferation. HuH-7 cells that bore shRNA against luciferase or DEPTOR were seeded on 48-well plates, and cell number at an indicated time point was evaluated by crystal violet staining. Data were normalized against OD595 values on d 1 of each treatment. Each experiment was performed in triplicate; error bars represent standard deviation (SD). **P < 0.01. (C) DEPTOR overexpression in HuH-7 cells caused an increase in the phosphorylation of Akt, whereas there was no obvious effect on the phosphorylation of S6K. (D) Transiently expressed DEPTOR in HuH-7 cells caused an increase in the phosphorylation of Akt, which could be counteracted by coexpression of GNMT or the N140S mutant GNMT. (E) DEPTOR overexpression extends survival of HuH-7 cells grown in medium containing 0.1% serum. GFP and DEPTOR stable cells were seeded on 48-well plates for 24 h (d 0); then cells were cultured in DMEM containing 0.1% serum. Cell proliferation was evaluated as described in (B). *P < 0.05; **P < 0.01. (F) Effects of DEPTOR and GNMT on apoptosis and autophagy in HuH-7 cells. Different HuH-7 stable cells were cultured in normal medium (10% serum) or in medium with 0.1% serum for 3 d and were then harvested and analyzed by Western blotting for indicated proteins. Each experiment was repeated three times. Panel B: ---○---, HuH-7-shLuc; —■—, HuH-7-shDEPTOR-1; — ▾— HuH-7-shDEPTOR-2; panel E: —○—, HuH-7-GFP; —●—, HuH-7-DEPTOR.
Figure 4
Figure 4
Effects of GNMT on mTOR signaling, cell cycle progression and proliferation. (A) Stably expression of GNMT in HuH-7 cells causes an increase in the phosphorylation of 4E-BP, which can be counteracted by transiently transfecting DEPTOR into a GNMT stable cell line. (B, C) GNMT does not interact with mTOR but interferes with the interaction between DEPTOR and mTOR. HuH-7 cells were transfected with indicated plasmids and harvested for immunoprecipitation analysis. Endogenous mTOR is not present in the anti-FLAG immunoprecipitants (B), and FLAG-tagged GNMT is not present in the precipitant pulled down by antibody against endogenous mTOR (C). In GNMT-expressing cells, the amount of DEPTOR in the mTOR precipitants is decreased and vice versa (C). (D) GNMT overexpression in HuH-7 cells led to a decrease in proliferation. GFP and GNMT stable cells were seeded on 48-well plate; cell proliferation was evaluated as described in Figure 3B. *P < 0.05. (E) GNMT overexpression in HuH-7 cells led to G2/M arrest. GFP and GNMT stable cells were synchronized at the G0/G1 phase and allowed to reenter the cell cycle. The cells were fixed at the indicated time point, and cell cycle profiles were recorded by flow cytometry. Quantification of the percentage of cells in the G2/M phase of the cell cycle is shown. Each experiment was repeated at least two times. (F) Expression of SA-β-gal in GFP and GNMT stable cells. Quantification of β-gal expression in GFP and GNMT stable cell lines are shown. Data are presented as means ± SD of 15–20 random fields with 100× magnification from two independent experiments. **P < 0.01. IP, immunoprecipitation; Ig H, IgG heavy chain; —○—, HuH-7-GFP; ----●----, HuH-7-GNMT.
Figure 5
Figure 5
GNMT sensitizes HuH-7 cells to rapamycin treatment. (A, B) The effect of rapamycin on the growth of HuH-7-GFP and HuH-7-GNMT cells. Viable cells were measured by using an MTT assay. The cell viability curves were drawn by using data from d 5. The y axis represents the percentages of viable cells compared with the solvent control. **P < 0.01. Each experiment was repeated three times. (C) Effects of RAD001 on growth rates of HuH-7-GNMT and HuH-7-GFP cells in xenografts. Mean tumor volume ± standard error of the mean at a given time is shown. Treatment with RAD001 of tumors formed by inoculation of GNMT stable cells (HuH-7-GNMT + RAD001, n = 10) resulted in a significant reduction of tumor growth in comparison with the other three groups (HuH-7-GFP + RAD001, n = 8; HuH-7-GFP + placebo, n = 8; and HuH-7-GNMT + placebo, n = 5). *P < 0.05. (D) Representative photomicrographs of IHC analysis for proliferation marker Ki-67 in xenografts from (C) and quantification of Ki-67+ cells in different groups. Data are expressed as means ± SD. Means not sharing the same lowercase letters (a and c) are significantly different (P < 0.05) (bar = 100 μm). Panel A: ---○---, HuH-7-GFP + 0 (nmol/L of rapamycin); formula image, HuH-7-GFP + 4; formula image, HuH-7-GFP + 20; formula image, HuH-7-GFP + 100; ●, HuH-7-GNMT + 0; formula image, HuH-7-GNMT + 4; formula image, HuH-7-GNMT + 20; formula image, HuH-7-GNMT + 100; panel B: —○—, HuH-7-GFP; ---●---, HuH-7-GNMT; panel C: —○—, HuH-7-GFP + placebo; formula image, HuH-7-GFP + RAD001; formula image, HuH-7-GNMT + placebo; formula image, HuH-7-GNMT + RAD001.

Similar articles

Cited by

References

    1. El-Serag HB, Rudolph KL. Hepatocellular carcinoma: epidemiology and molecular carcinogenesis. Gastroenterology. 2007;132:2557–76. - PubMed
    1. Finn RS. Development of molecularly targeted therapies in hepatocellular carcinoma: where do we go now? Clin Cancer Res. 2010;16:390–7. - PubMed
    1. Llovet JM, Bruix J. Molecular targeted therapies in hepatocellular carcinoma. Hepatology. 2008;48:1312–27. - PMC - PubMed
    1. Sahin F, et al. mTOR and P70 S6 kinase expression in primary liver neoplasms. Clin Cancer Res. 2004;10:8421–5. - PubMed
    1. Villanueva A, et al. Pivotal role of mTOR signaling in hepatocellular carcinoma. Gastroenterology. 2008;135:1972–83. - PMC - PubMed

Publication types

MeSH terms