. 2011 Dec 27;108(52):20929-34.
doi: 10.1073/pnas.1112381108. Epub 2011 Dec 12.

Cumulative impacts of mountaintop mining on an Appalachian watershed

Affiliations

Cumulative impacts of mountaintop mining on an Appalachian watershed

T Ty Lindberg et al. Proc Natl Acad Sci U S A. .

Abstract

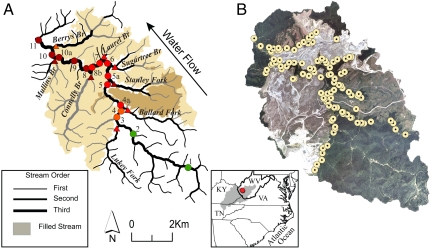
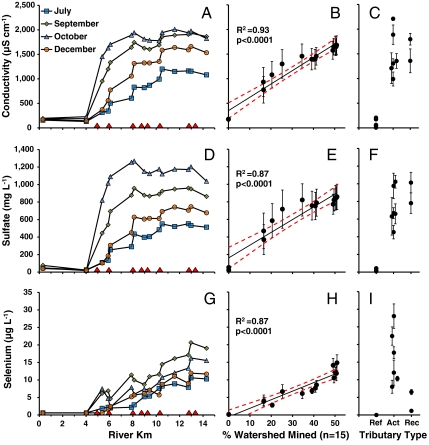
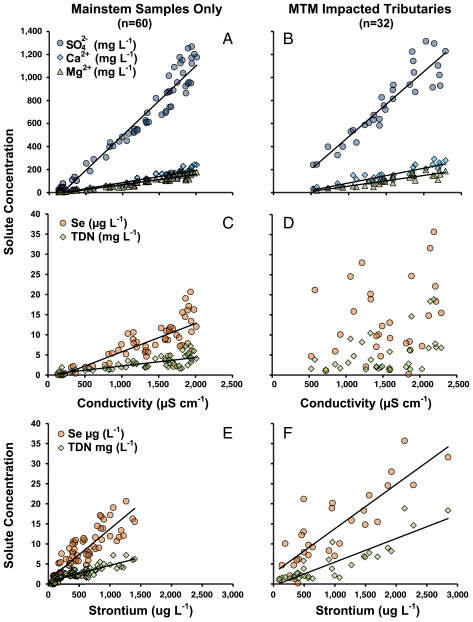
Mountaintop mining is the dominant form of coal mining and the largest driver of land cover change in the central Appalachians. The waste rock from these surface mines is disposed of in the adjacent river valleys, leading to a burial of headwater streams and dramatic increases in salinity and trace metal concentrations immediately downstream. In this synoptic study we document the cumulative impact of more than 100 mining discharge outlets and approximately 28 km(2) of active and reclaimed surface coal mines on the Upper Mud River of West Virginia. We measured the concentrations of major and trace elements within the tributaries and the mainstem and found that upstream of the mines water quality was equivalent to state reference sites. However, as eight separate mining-impacted tributaries contributed their flow, conductivity and the concentrations of selenium, sulfate, magnesium, and other inorganic solutes increased at a rate directly proportional to the upstream areal extent of mining. We found strong linear correlations between the concentrations of these contaminants in the river and the proportion of the contributing watershed in surface mines. All tributaries draining mountaintop-mining-impacted catchments were characterized by high conductivity and increased sulfate concentration, while concentrations of some solutes such as Se, Sr, and N were lower in the two tributaries draining reclaimed mines. Our results demonstrate the cumulative impact of multiple mines within a single catchment and provide evidence that mines reclaimed nearly two decades ago continue to contribute significantly to water quality degradation within this watershed.


Conflict of interest statement

The authors declare no conflict of interest.

Figures

Fig. 1.
Fig. 1.
Map of study area depicting Upper Mud River and associated tributaries with aerial photo on right. Sampling sites consisted of 15 mainstem (circles) and eight named tributary locations (triangles). Sites 1 and 2 were located upstream of current and historic MTM activity. The remaining sites were chosen so as to bracket each confluence of the Upper Mud River and an MTM-affected tributary. Marker color denotes median conductivity level in mainstem during survey (green < 300, orange 301 to 500, red 501 to 1,000, and dark red > 1,000 μS cm-1). Brown shaded areas reflect surface mining with darker area representing reclaimed mines. Aerial photo on right shows location of 105 active surface-mining-related outlets within the watershed that are regulated through eight NPDES permits. Inset of US mid-Atlantic states shows Appalachian coalfield region as gray shaded area with relative location of study site in red (not to scale).
Fig. 2.
Fig. 2.
Longitudinal patterns of conductivity and stream solutes and their correlation to the areal extent of upstream surface mining. Increases in conductivity (A), sulfate (D), and selenium (G) on the mainstem of the Upper Mud River are shown for the four most complete survey months in the study. The locations of MTM-impacted tributary inflows are indicated by red triangles on the x axis. The proportion of the contributing watershed in surface mines explains a significant fraction of the variation in stream water conductivity (B) sulfate (E), and selenium (H) concentrations in the mainstem of the Mud River (error bars denote standard error of the mean for the four monthly measurements, red dashed line is the 95% confidence interval for the regression line). The variation in conductivity and solute concentrations in the mainstem are directly compared to data over the same four dates for the eight state reference streams (Ref) within the Upper Guyandotte watershed (data from WVDEP) (10) and tributaries within the Mud River that drained either watersheds with active MTM (Act) or watersheds with historic surface mines reclaimed nearly 20 years ago (Rec). Our detection limit for selenium was 1.1 μg L-1.
Fig. 3.
Fig. 3.
Correlations between a variety of stream solutes are compared for the mainstem and eight MTM-impacted tributaries. Sulfate, magnesium, and calcium concentrations are strongly correlated to conductivity in both the mainstem (R2 = 0.93, 0.90, 0.88, respectively; p < 0.0001) (A) and in the affected tributaries (R2 = 0.83, 0.78, 0.81, respectively; p < 0.0001) (B). Total dissolved nitrogen (TDN) and selenium are strongly related to conductivity in the mainstem (R2 = 0.57, 0.69, respectively; p < 0.0001) (C) but not across the MTM-impacted tributaries (D). TDN and selenium concentrations are more strongly associated with strontium in both the mainstem (R2 = 0.81, 0.76, respectively; p < 0.0001) (E) and the MTM-impacted tributaries (R2 = 0.76, 0.69, respectively; p < 0.0001) (F). Differences in sample size are a result of there being 15 mainstem sites and eight tributary sites each sampled four times.
Fig. 4.
Fig. 4.
Effects of selenium toxicity on two species of fish. (Upper) One of two Lepomis sp. hybrids caught at site 7 showing cranial-facial deformities typical of selenium toxicity. (Lower) Female creek chub (Semolitus atromaculatus) from site 10 with lordosis deformity typical of selenium toxicity.

References

    1. The Effects of Mountaintop Mines and Valley Fills on Aquatic Ecosystems of the Central Appalachian Coalfields. Washington: US Environmental Protection Agency; 2011. EPA/600/R-09/138F.
    1. White MA, Barata FA. State-of-the-art in mountaintop removal and contour mining. Min Eng. 1995;47:1111–1114.
    1. Slonecker ET, Benger MJ. Remote sensing and mountaintop mining. Rem Sens Rev. 2001;20:293–322.
    1. Bernhardt ES, Palmer MA. The environmental costs of mountaintop mining valley fill operations for aquatic ecosystems of the Central Appalachians. Ann N Y Acad Sci. 2011;1223:39–57. - PubMed
    1. Mountaintop Mining/Valley Fills in Appalachia:Final Programmatic Environmental Impact Statement. Philadelphia: US Environmental Protection Agency; 2005. EPA 9-03-R-05002.

Publication types

MeSH terms