. 2011 Dec 27;108(52):21087-92.
doi: 10.1073/pnas.1111408109. Epub 2011 Dec 12.

Antagonistic gene transcripts regulate adaptation to new growth environments

Affiliations

Antagonistic gene transcripts regulate adaptation to new growth environments

Bridget L Baumgartner et al. Proc Natl Acad Sci U S A. .

Abstract

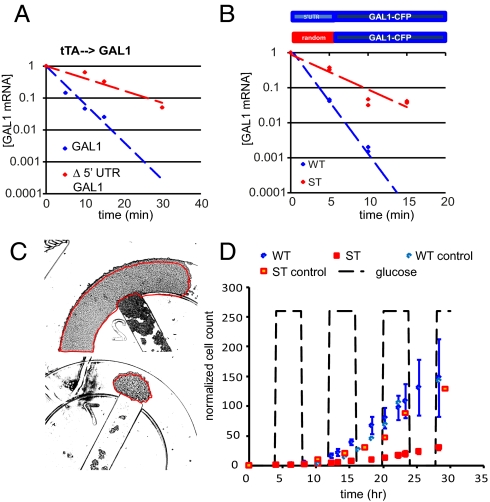
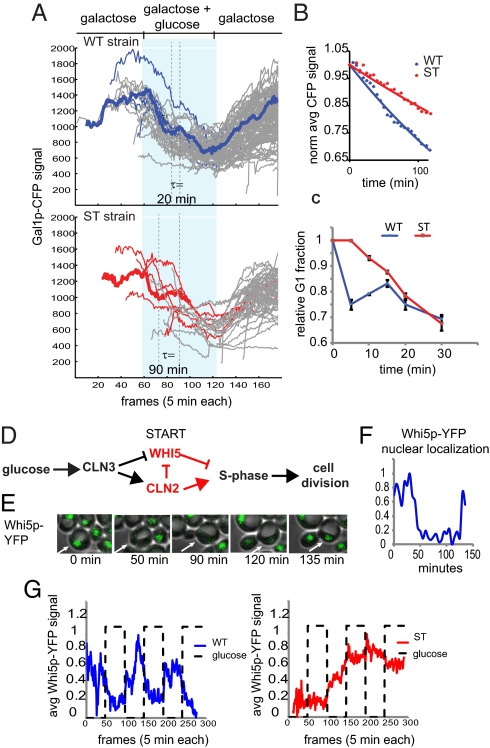
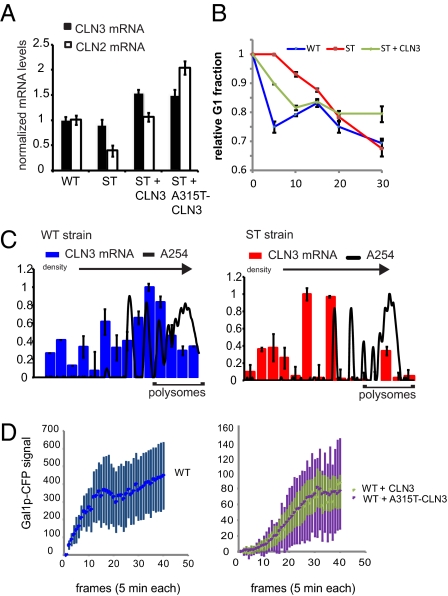
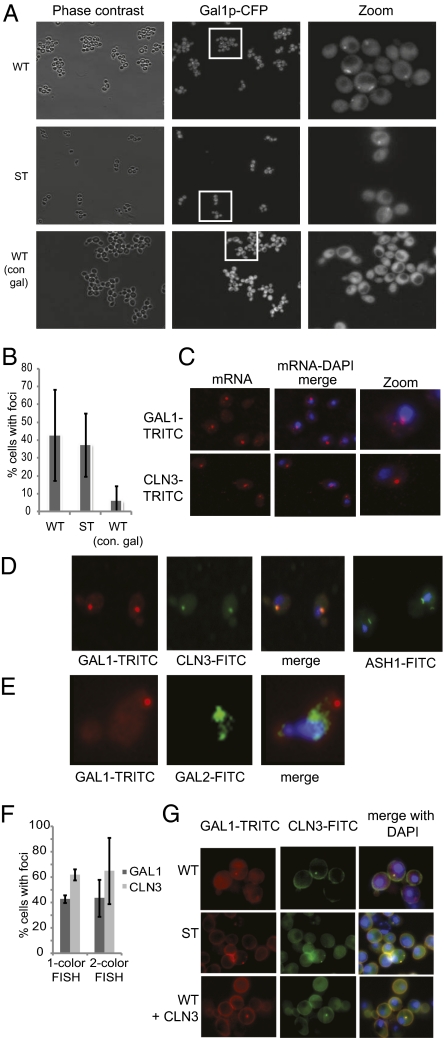
Cells have evolved complex regulatory networks that reorganize gene expression patterns in response to changing environmental conditions. These changes often involve redundant mechanisms that affect various levels of gene expression. Here, we examine the consequences of enhanced mRNA degradation in the galactose utilization network of Saccharomyces cerevisiae. We observe that glucose-induced degradation of GAL1 transcripts provides a transient growth advantage to cells upon addition of glucose. We show that the advantage arises from relief of translational competition between GAL1 transcripts and those of cyclin CLN3, a translationally regulated initiator of cell division. This competition creates a translational bottleneck that balances the production of Gal1p and Cln3p and represents a posttranscriptional control mechanism that enhances the cell's ability to adapt to changes in carbon source. We present evidence that the spatial regulation of GAL1 and CLN3 transcripts is what allows growth to be maintained during fluctuations of glucose availability. Our results provide unique insights into how cells optimize energy use during growth in a dynamic environment.


Conflict of interest statement

The authors declare no conflict of interest.

Figures

Fig. 1.
Fig. 1.
Cells expressing stable GAL1 transcripts do not grow well in a dynamic environment. (A) Decay of tTA-driven GAL1transcripts, with (blue) and without (red) the 5′-UTR, in cells growing in glucose. Deletion of the 5′-UTR increased the half-life of the GAL1 transcript in glucose. (B) A schematic of the GAL1 transcript produced in WT and ST strains. The GAL1 mRNA levels measured by qRT-PCR in WT (blue) and ST (red) strains are plotted as normalized mRNA concentration vs. time after addition of glucose to the growth medium. GAL1-CFP mRNA decayed with a half-life of ∼3 min in WT and ∼9 min in ST. (C) Individual WT and ST colonies were grown in eight separate traps of a single microfluidic chip. There were three traps for each strain fed with galactose plus 4-h pulses of glucose every 4 h and one trap each for the galactose-only controls. Each colony was started from 25 to 75 cells. The growth of each colony was monitored over time by measuring the total area of the cells in each trap. The micrographs shown are final frames for one WT (Upper) and one ST (Lower) trap, both started from 31 cells, and were grown for 30 h under the dynamic conditions. (D) Results of the dynamic growth experiment. The number of cells in each trap was estimated from the total area of the colony and normalized to the number of cells in frame 1. The average sizes of the WT and ST colonies were plotted vs. time; error bars = 1 SD.
Fig. 2.
Fig. 2.
Cells expressing stable GAL1 transcripts are impaired in the cell cycle response to glucose. (A) The cells were grown in a microfluidic chemostat under conditions of constant 0.5% galactose, supplemented with a 5-h square wave impulse of 0.25% glucose every 5 h. Single-cell Gal1p-CFP trajectories were recorded in individual cells by time-lapse fluorescence microscopy. The period of glucose addition is represented by the light blue shaded region. For each strain, the trajectories of five cells are highlighted in blue (WT) or red (ST). Cell divisions can be detected in the individual trajectories as sharp dips in fluorescence. The time elapsed between divisions (τ) is indicated for a representative trajectory for each strain, shown as a thick line. (B) The average Gal1p-CFP level for a population of cells (n = 25) after glucose addition is plotted vs. time (min). (C) xy plot of the change in the relative size of the G1 population over time after glucose addition, as measured by flow cytometry. (D) Increased global levels of protein synthesis in response to glucose lead to the production of Cln3p. Cln3p enters the nucleus and causes Whi5p, an inhibitor of S phase, to be expelled from the nucleus and induces the expression of a number of cell cycle genes, such as CLN2, that promote S phase and reinforce the cytoplasmic retention of Whi5p. (E) Cells expressing Whi5p-YFP were grown in a microfluidic chemostat and imaged every 5 min, using time-lapse fluorescence microscopy. Whi5p-YFP is easily detected in the nuclei of G1 cells, but the signal is weak when Whi5p is dispersed in the cytoplasm upon cell cycle entry. The fluorescent micrographs show changes in Whi5p-YFP localization as a WT cell divides in galactose medium. (F) The Whi5p-YFP trajectory of the cell shown in E, scaled from 0 to 1. (G) The average Whi5p-YFP signal plotted against time for single WT (n = 224) and ST (n = 493) cells growing in constant galactose with 4-h pulses of glucose every 4 h. See Fig. S3 for individual trajectories.
Fig. 3.
Fig. 3.
GAL1 and CLN3 transcripts are mutually antagonistic. (A) Summary of CLN3 and CLN2 mRNA levels, as measured by qRT-PCR in WT, ST, ST + CLN3, and ST + A315T-CLN3 strains 10 min after glucose addition. (B) xy plot of the change in the relative size of the G1 population over time after glucose addition, as measured by flow cytometry. (C) Polysome distribution of CLN3 mRNA in WT (Left) and ST (Right) cells just after glucose addition; error bars indicate ±1 SD. The sucrose gradient increases from left to right. A254 signal identifies the fractions containing translation complexes with increasing numbers of ribosomes. These graphs are representative of results obtained from at least three independent experiments. See SI Text for polysome distributions of cells growing in galactose. (D) Average Gal1p-CFP accumulation in WT (Left) and WT + CLN3[A315T] (Right) cells growing in a microfluidic chemostat; error bars are ±1 SD.
Fig. 4.
Fig. 4.
GAL1 and CLN3 mRNA are spatially coregulated. (A) Live cell imaging. Gal1p-CFP was detected in one to two foci in WT and ST cells growing under dynamic conditions. In contrast, Gal1p-CFP foci were rarely seen in WT cells that had been growing in galactose for >24 h. (B) Quantitation of Gal1p-CFP foci in WT and ST cells. (C) FISH of GAL1 and CLN3 transcripts in K699 cells (parent strain), 2.5 h after being switched from glucose to galactose. GAL1 mRNA was detected as one to two large brightly stained foci, with several smaller foci distributed throughout the cytoplasm. CLN3 mRNA was mostly detected in one to two large foci. (D) Two-color FISH of GAL1(TRITC) and CLN3(FITC) in K699 cells, 2.5 h after being switched from glucose to galactose; 99% of the CLN3 foci overlapped with a GAL1 focus, in cells for which both signals were detected. As a control, we observed the expected localization pattern for ASH1 mRNA (bud neck) (23). (E) Two-color FISH of GAL1(TRITC) and GAL2(FITC) in K699 cells, 2.5 h after being switched from glucose to galactose. No overlap between the two transcripts was observed. (F) Quantitation of foci detected in one-color and two-color FISH experiments. These results are averaged from at least three independent hybridizations. (G) Two-color FISH results from experiments in which the detergent wash was omitted to preserve the three-dimensional shape of the cells. GAL1(TRITC) and CLN3(FITC) foci overlapped in WT and ST strains, 2.5 h after being switched from glucose to galactose.

References

    1. Jacob F, Monod J. Genetic regulatory mechanisms in the synthesis of proteins. J Mol Biol. 1961;3:318–356. - PubMed
    1. Youk H, van Oudenaarden A. Growth landscape formed by perception and import of glucose in yeast. Nature. 2009;462:875–879. - PMC - PubMed
    1. Ronen M, Botstein D. Transcriptional response of steady-state yeast cultures to transient perturbations in carbon source. Proc Natl Acad Sci USA. 2006;103:389–394. - PMC - PubMed
    1. Shalem O, et al. Transient transcriptional responses to stress are generated by opposing effects of mRNA production and degradation. Mol Syst Biol. 2008;4:223. - PMC - PubMed
    1. Pérez-Ortín JE, Alepuz PM, Moreno J. Genomics and gene transcription kinetics in yeast. Trends Genet. 2007;23:250–257. - PubMed

Publication types

MeSH terms