. 2012 Jan 31;109(5):1607-12.
doi: 10.1073/pnas.1117194109. Epub 2011 Dec 12.

Polyfunctional responses by human T cells result from sequential release of cytokines

Affiliations

Polyfunctional responses by human T cells result from sequential release of cytokines

Qing Han et al. Proc Natl Acad Sci U S A. .

Abstract

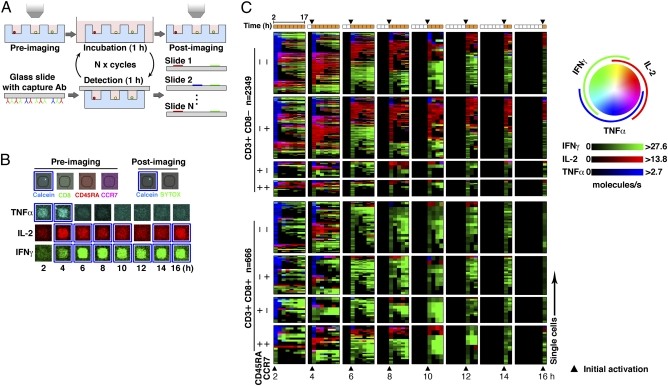
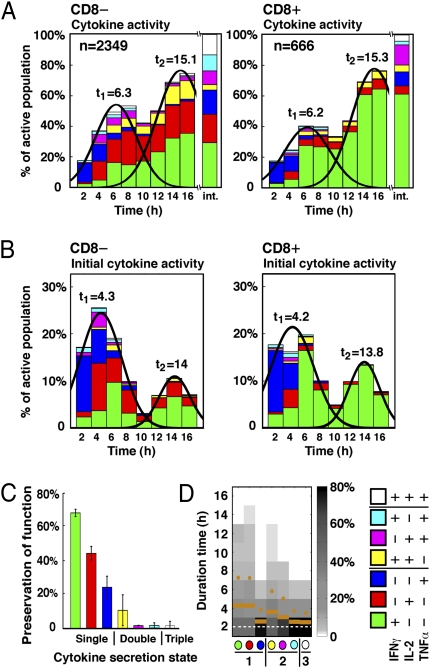
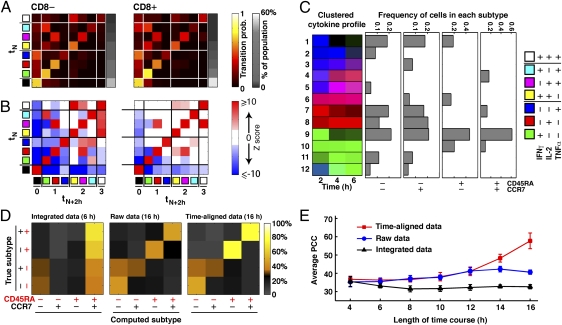
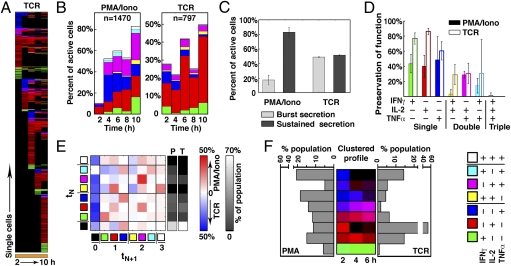
The release of cytokines by T cells defines a significant part of their functional activity in vivo, and their ability to produce multiple cytokines has been associated with beneficial immune responses. To date, time-integrated end-point measurements have obscured whether these polyfunctional states arise from the simultaneous or successive release of cytokines. Here, we used serial, time-dependent, single-cell analysis of primary human T cells to resolve the temporal dynamics of cytokine secretion from individual cells after activation ex vivo. We show that multifunctional, Th1-skewed cytokine responses (IFN-γ, IL-2, TNFα) are initiated asynchronously, but the ensuing dynamic trajectories of these responses evolve programmatically in a sequential manner. That is, cells predominantly release one of these cytokines at a time rather than maintain active secretion of multiple cytokines simultaneously. Furthermore, these dynamic trajectories are strongly associated with the various states of cell differentiation suggesting that transient programmatic activities of many individual T cells contribute to sustained, population-level responses. The trajectories of responses by single cells may also provide unique, time-dependent signatures for immune monitoring that are less compromised by the timing and duration of integrated measures.


Conflict of interest statement

The authors declare no conflict of interest.

Figures

Fig. 1.
Fig. 1.
Cytokine secretion dynamics for individual T cells upon activation. (A) Illustration of serial microengraving to monitor cytokine secretion by viable single T cells in time. (B) Representative micrographs of data evaluating viability (Calcein and SYTOX); phenotype (CD8, CD45RA, and CCR7); and TNFα (blue), IL-2 (red), and IFN-γ (green) secretion. Blue squares outline positive events. (C) Cytokine secretion kinetics of 3,015 viable T cells. Each row within each block reflects the dynamic activity of an individual T cell over time. The color wheel illustrates the type and relative magnitude of secreted cytokines; inactivity is black. Block columns and block rows organize cytokine profiles by initial time of activity and differentiated cell types, respectively. Kinetic profiles are ordered within each block according to cytokine function. These data are representative from three independent experiments.
Fig. 2.
Fig. 2.
Distribution and stability of secretory states. (A) Histograms of the total percentage of actively secreting cells as a function of time and class (CD3+CD8/CD3+CD8+), and their corresponding state distributions. The rightmost bar represents the integrated responses over 2–16 h. n is the total number of cells in the given dataset. (B) Histograms of the total percentage of cells that initiate cytokine secretion at each time point, and their corresponding state distributions. The early and late responses were fit to Gaussian curves (t, mean time). (C) Bar graph of the probability that a given cell preserves its functional state in 16 h. The secretory states for cells at 4, 6, and 8 h were used as independent reference points. Error bars indicate SD. (D) Heatmap indicating lifetime of secretory states. Solid orange lines reflect mean lifetime; orange dots reflect the mean plus 1 SD; white dashed line reflects the lower limit of detection, 2 h. All subtypes of T cells were included in C and D.
Fig. 3.
Fig. 3.
Functional evolution and T-cell discrimination. (A) Transition matrices for CD8 and CD8+ T cells. Frequencies of transitions were normalized across each row to show the likelihood that a cell in any given state would transition to a new state in the next sampling period. The adjacent gray scale bar reflects the relative frequency of each state over 16 h. (B) Z scores highlight transitions that occur with significantly more/less frequency than expected by chance. Z scores indicate significant transitions (>2, red; <2, blue); insignificant values (within ±2) are white. (C) Common time-aligned cytokine secretion profiles of CD8 T cells (determined by SOM) and their relative percent distribution within each differentiated subset of T cells. Colorimetric representation of cytokine states are consistent with Fig. 1C. (D) Matrices depicting the accuracy of classification of CD8 T-cell subtypes based on dynamic secretion profiles. These “confusion matrices” quantify the percent of accurately classified cell types (defined by surface cell markers) computed by PCA relative to the true subtypes (identified by their cell surface markers). The color bar reflects the percentage of cells classified as a certain subtype; uniform random assignment (25%) and below is denoted in black and gray scale, respectively. (E) Average percent correct classification (PCC) of CD3+CD8 T-cell subtypes over 10 independent, randomly sampled iterations as a function of the length of dynamic trajectory. Error bars indicate SD.
Fig. 4.
Fig. 4.
T-cell receptor-dependent stimulation and corresponding dynamic T-cell responses. (A) Temporal cytokine profiles from 797 viable T cells stimulated over 10 h with anti-CD3/CD28. Colors, intensities, and rates of secretion are consistent with Fig. 1C. (B) Comparison of the frequencies of cytokine-secreting cells from the same subject stimulated with PMA/ionomycin (Left) and anti-CD3/CD28 (Right). (C) Bar graph of the normalized average distributions of sustained (>2 h) or burst-like (2 h) secretions by activated T cells as a function of stimulation. Error bars indicate SD. (D) Bar graph depicting the probability that a given cell preserves its functional state in the 10-h period upon stimulation with PMA/ionomycin (filled bars) and anti-CD3/CD28 (open bars). Error bars indicate SD. (E) Matrix reflecting the differential normalized probabilities of T-cell state transitions upon PMA/ionomycin (red, P) and anti-CD3/CD28 (blue, T) stimulation. Cells were randomly sampled from each dataset to compare equal population sizes (n = 797). Gray scale bars reflect the relative frequencies of states within each dataset. (F) Common trajectories that are accessed by PMA/ionomycin and TCR-dependent stimulated T cells. An equal number of cells (n = 478) were randomly sampled from each population, combined, and used for SOM clustered. The distributions of accessibility for cells to these trajectories are shown in adjacent histograms. Data are representative from experiments for three different donors. All T-cell subtypes were included in A–E; only CD3+CD8 T cells were included in F.

Comment in

References

    1. Sallusto F, Lanzavecchia A. Heterogeneity of CD4+ memory T cells: Functional modules for tailored immunity. Eur J Immunol. 2009;39:2076–2082. - PubMed
    1. Seder RA, Darrah PA, Roederer M. T-cell quality in memory and protection: Implications for vaccine design. Nat Rev Immunol. 2008;8:247–258. - PubMed
    1. Appay V, van Lier RAW, Sallusto F, Roederer M. Phenotype and function of human T lymphocyte subsets: Consensus and issues. Cytometry A. 2008;73:975–983. - PubMed
    1. Zhou L, Chong MMW, Littman DR. Plasticity of CD4+ T cell lineage differentiation. Immunity. 2009;30:646–655. - PubMed
    1. Betts MR, et al. HIV nonprogressors preferentially maintain highly functional HIV-specific CD8+ T cells. Blood. 2006;107:4781–4789. - PMC - PubMed

Publication types