. 2012 Jan 10;109(2):E93-102.
doi: 10.1073/pnas.1118434109. Epub 2011 Dec 12.

Structural basis for gating charge movement in the voltage sensor of a sodium channel

Affiliations

Structural basis for gating charge movement in the voltage sensor of a sodium channel

Vladimir Yarov-Yarovoy et al. Proc Natl Acad Sci U S A. .

Abstract

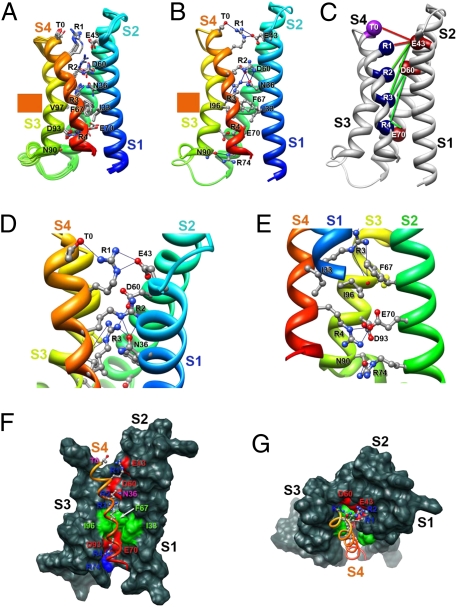
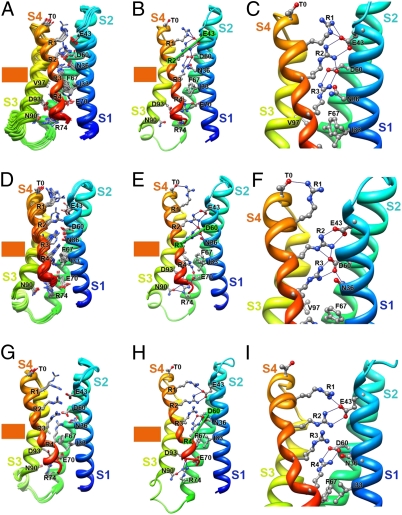
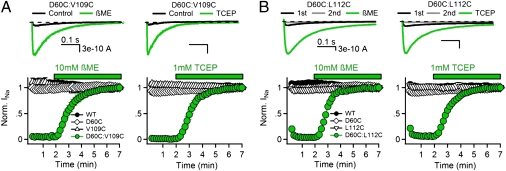
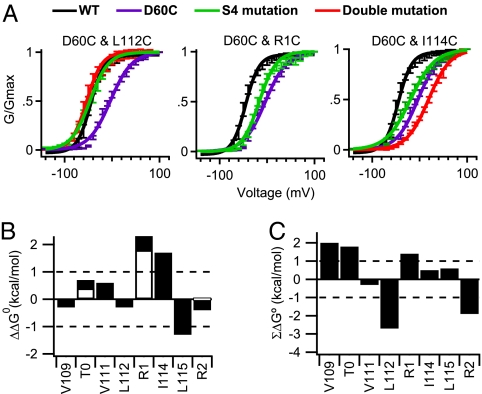
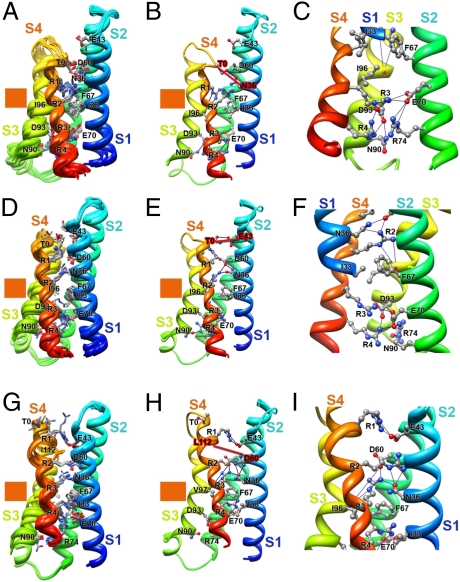
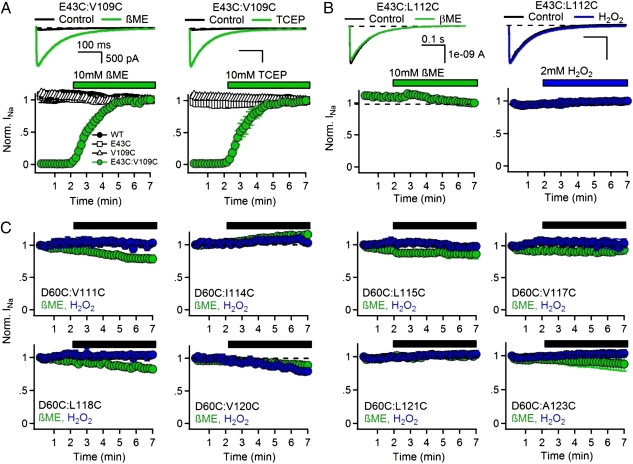
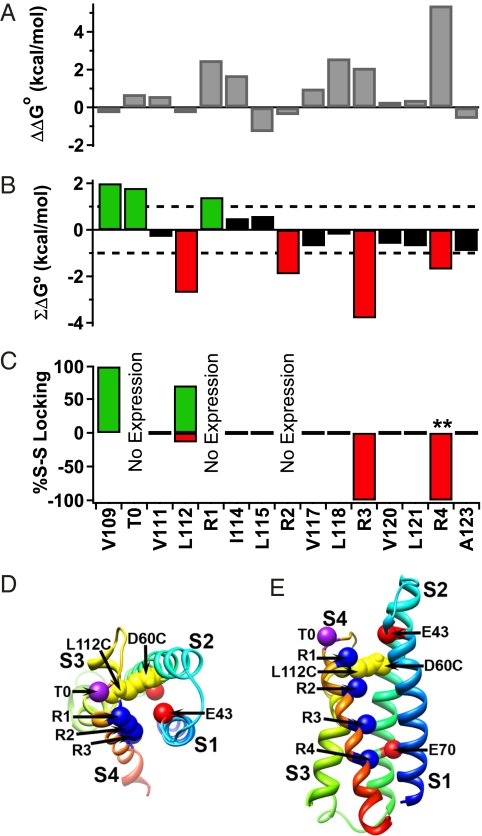
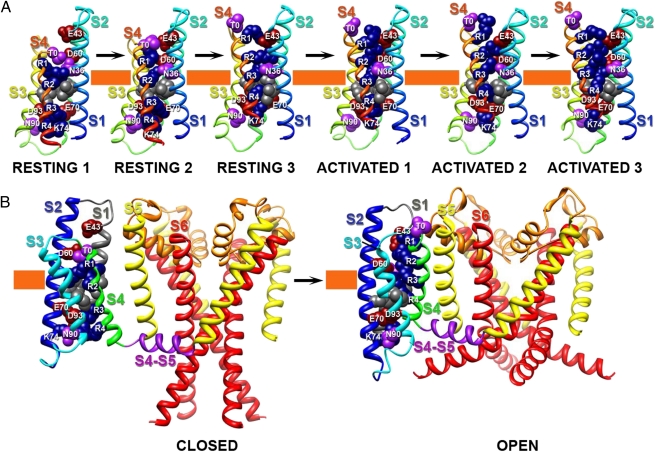
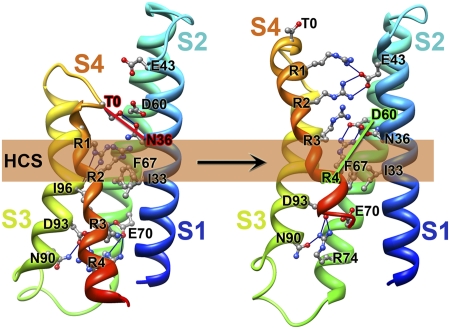
Voltage-dependent gating of ion channels is essential for electrical signaling in excitable cells, but the structural basis for voltage sensor function is unknown. We constructed high-resolution structural models of resting, intermediate, and activated states of the voltage-sensing domain of the bacterial sodium channel NaChBac using the Rosetta modeling method, crystal structures of related channels, and experimental data showing state-dependent interactions between the gating charge-carrying arginines in the S4 segment and negatively charged residues in neighboring transmembrane segments. The resulting structural models illustrate a network of ionic and hydrogen-bonding interactions that are made sequentially by the gating charges as they move out under the influence of the electric field. The S4 segment slides 6-8 Å outward through a narrow groove formed by the S1, S2, and S3 segments, rotates ∼30°, and tilts sideways at a pivot point formed by a highly conserved hydrophobic region near the middle of the voltage sensor. The S4 segment has a 3(10)-helical conformation in the narrow inner gating pore, which allows linear movement of the gating charges across the inner one-half of the membrane. Conformational changes of the intracellular one-half of S4 during activation are rigidly coupled to lateral movement of the S4-S5 linker, which could induce movement of the S5 and S6 segments and open the intracellular gate of the pore. We confirmed the validity of these structural models by comparing with a high-resolution structure of a NaChBac homolog and showing predicted molecular interactions of hydrophobic residues in the S4 segment in disulfide-locking studies.


Conflict of interest statement

The authors declare no conflict of interest.

Figures

Fig. 1.
Fig. 1.
Model of the VSD of NaChBac. (A) Transmembrane view of the ensemble of the 10 lowest energy Rosetta models of the VSD of NaChBac built starting from the KV1.2-KV2.1 chimera channel structure (19). Side chains of the gating charge-carrying arginines in S4 and key residues in S1–S3 segments are shown in stick representation and labeled. Gray, blue, and red atoms are C, N, and O, respectively. The HCS is highlighted by orange bars. (B) The lowest energy Rosetta model of the VSD of NaChBac. Hydrogen bonds between side chains of key residues are shown as blue lines. (C) Transmembrane view of the model shown in B with Cβ-atoms of the gating charge carrying arginines in S4 (colored dark blue), negatively charged residues in S1 and S2 segments (colored red), and T0 in S4 (colored purple) shown in sphere representation and labeled. Disulfide cross-linking–based distance constraints between the gating charge carrying arginines in S4 and negatively charged residues in S1 and S2 are shown by solid red lines for the resting state interactions and solid green lines for the activated state interactions. (D) Close-up view of key interactions in the model shown in B in the extracellular one-half of VSD. (E) Close-up view of key interactions in the model shown in B in the intracellular one-half of VSD. (F) Transmembrane view of the model shown in B with S1–S3 segments shown in surface representation with highly conserved negatively charged and polar residues colored red, positively charged R74 in S2 colored blue, and highly conserved hydrophobic residues in S1–S3 colored green. (G) View of the model shown in F from the extracellular side of the membrane.
Fig. 2.
Fig. 2.
Models of the VSD of NaChBac in activated states. (A) Transmembrane view of the ensemble of the 10 lowest energy Rosetta models of the VSD of NaChBac in Activated State 1 as presented in Fig. 1A. (B) The lowest energy Rosetta model of the VSD of NaChBac in Activated State 1. (C) Close-up view of key interactions in the model shown in B for the extracellular one-half of the VSD. R1 forms an ion pair with E43 (in S1), R2 forms an ion pair with E43 (in S1) and D60 (in S2), R3 forms an ion pair with D60 (in S2) and a hydrogen bond with N36 (in S1), and R4 forms an ion pair with E70 (in S2; B). (D) Transmembrane view of the ensemble of the 10 lowest energy Rosetta models of the VSD of NaChBac in Activated State 2. (E) The lowest energy Rosetta model of the VSD of NaChBac in Activated State 2. (F) Close-up view of key interactions in the model shown in E in the extracellular one-half of VSD. The lowest energy models predict that R1 forms a hydrogen bond with T0 (in S4), R2 forms an ion pair with E43 (in S1) and D60 (in S2), and R3 forms an ion pair with D60 (in S2). (G) Transmembrane view of the ensemble of the 10 lowest energy Rosetta models of the VSD of NaChBac in Activated State 3. (H) The lowest energy Rosetta model of the VSD of NaChBac in Activated State 3. (I) Close-up view of key interactions in the model shown in H at the extracellular one-half of VSD. The lowest energy models predict that R1 forms an ion pair with E43 (in S1), R2 forms an ion pair with E43 (in S1), R3 forms a hydrogen bond with Y156 (in S5) and makes ionic interactions with D60 (in S2) and E43 (in S1), and R4 forms an ion pair with D60 (in S2).
Fig. 3.
Fig. 3.
Disulfide-locking cysteine residues substituted for D60 and the S4 hydrophobic residues V109 and L112. (A, Upper and B, Upper) INa from voltage-clamped tsA-201 cells expressing (A) D60C:V109C and (B) D60C:L112C channels. INa elicited by the first pulse in control conditions (black), the second pulse in control conditions (gray), and the last pulse in the presence of reducing agent (green) during a train of 500-ms depolarizations to 0 mV from a holding potential of −140 mV. (A, Lower and B, Lower) Effects of reducing agents 10 mM βME and 1 mM TCEP (green bars) on the mean normalized peak currents recorded from cells expressing (A) D60C:V109C and (B) D60C:L112C channels (±SEM) recorded during the trains (n = 5–6).
Fig. 4.
Fig. 4.
Mutant cycle analysis of D60 interactions with the outer gating charges and hydrophobic residues in the resting state. (A) Conductance–voltage relationships are plotted for WT, D60C, the indicated single cysteine S4 mutations, and their double cysteine mutants (n > 9; ±SEM) (SI Appendix, Table S2). (B) Perturbation of free energy (ΔΔG°) caused by single cysteine mutations to cysteine (filled bars) or alanine (open bars). (C) Mutant cycle analysis for double mutants of D60C and the indicated S4 residues mutated to cysteine for hydrophobic residues or alanine for gating charge positions T0, R1, or R2. ΣΔG° is the nonadditive free energy. Because the D60C:V109C channels are disulfide-locked in a resting state, the voltage dependence of activation could only be assessed with βME present.
Fig. 5.
Fig. 5.
Models of the VSD of NaChBac in resting states. (A) Transmembrane view of the ensemble of the 10 lowest energy Rosetta models of the VSD of NaChBac in Resting State 1 presented as in Fig. 1A. (B) The lowest energy Rosetta model of the VSD of NaChBac in Resting State 1. (C) Close-up view of key interactions in the model shown in B at the intracellular one-half of the VSD. The majority of the lowest energy models predict that R1 forms hydrogen bonds with the backbone carbonyl of I96 (in S3) at the extracellular edge of the HCS. On the intracellular side of the HCS, R3 makes ionic interactions with the amino acid residues of the intracellular negatively charged cluster, including E70 (in S2) and D93 (in S3), and R4 forms an ion pair with D93 (in S3). (D) Transmembrane view of the ensemble of the 10 lowest energy Rosetta models of the VSD of NaChBac in Resting State 2 based on D60-V109 constraint. (E) The lowest energy Rosetta model of the VSD of NaChBac in Resting State 2 based on the D60-V109 constraint. (F) Close-up view of key interactions in the model shown in E in the extracellular one-half of VSD. The majority of the lowest energy models predict that R1 forms an ion pair with D60 (in S2), R2 makes ionic interactions with D60 and hydrogen bonds with N36 (in S1) and the backbone carbonyl of I96 (in S3), R3 forms an ion pair with E70 (in S2), and R4 makes ionic interactions with E70 (in S2) and D93 (in S3). (G) Transmembrane view of the ensemble of the 10 lowest energy Rosetta models of the VSD of NaChBac in Resting State 3 based on D60-L112 constraint. (H) The lowest energy Rosetta model of the VSD of NaChBac in Resting State 3 based on the D60-L112 constraint. (I) Close-up view of key interactions in the model shown in H in the extracellular one-half of VSD. On the extracellular side of the HCS, the majority of the lowest energy models predict that R1 forms an ion pair with E43 (in S1), R2 forms hydrogen bonds with N36 (in S1), and R3 forms an ion pair with D60 and hydrogen bonds with N36 (in S1) and the backbone carbonyl of I96 (in S3). In contrast, R4 forms an ion pair with E70 (in S2), a member of the intracellular negatively charged cluster.
Fig. 6.
Fig. 6.
Disulfide locking of cysteine residues substituted for amino acid residues in the S4 segment. (A, Upper and B, Upper) INa from the first pulse in control conditions (black) and last pulse in the presence of reducing agent (green) or oxidizing agents (blue) elicited by a 0.1-Hz train of 500-ms depolarizations to 0 mV from a holding potential of −140 mV. (A, Lower and B, Lower) Effects of reducing agents 10 mM βME and 1 mM TCEP (green bars) or 2 mM H2O2 (blue bar) on the mean normalized peak currents (±SEM) recorded during the stimulus trains (n = 5–6). (C) Lack of disulfide locking of cysteine residues substituted for D60 with the indicated hydrophobic residues in the S4 segment. Mean normalized peak currents (±SEM) are plotted from stimulus trains, and the black bar indicates the time when 10 mM βME (green) or 2 mM H2O2 (blue) were perfused (n = 4).
Fig. 7.
Fig. 7.
Mutant cycle analysis of energy coupling between D60 and interacting residues in the S4 segment. (A) The perturbation of free energy (ΔΔG°) from single cysteine mutations to the S4 of the NaChBac channel. (B) Summary of results of mutant cycle analysis (SI Appendix, Table S2) of double cysteine mutations of S4 residues in combination with D60C. Green bars indicate energy coupling favoring deactivation, red bars indicate energy coupling favoring activation, and black bars indicate no energy coupling. All of the indicated S4 residues are mutated to cysteine except T0A, R1A, and R2A. (C) Summary of disulfide interactions of S4 amino acid residues with D60C in the resting (green) and activated (red) states as assessed by disulfide locking. (D) Low-resolution Rosetta model of the gating pore viewed from the extracellular side. Note the linear array of S4 gating charges opposite D60 and E43. (E) Low-resolution Rosetta model of the gating pore viewed from the membrane.
Fig. 8.
Fig. 8.
Model of conformational changes in NaChBac during gating. (A) Transmembrane view of the ribbon representation of Rosetta models of three resting and three activated states of the VSD of NaChBac. Segments S1–S4 are colored individually and labeled. Side chain atoms of the gating charge-carrying arginines in S4 (colored dark blue), negatively charged residues in S1–S3 segments (colored red), polar residues in S1, S3, and S4 (colored purple), and key hydrophobic residues in S1–S3 (colored gray) are shown in sphere representation and labeled. The HCS is highlighted by orange bars. (B) Transmembrane view of the ribbon representation of Rosetta models of Resting State 1 and Activated State 3 of NaChBac VSD and pore domain. Only a single VSD is shown attached to a tetramer of the pore domain for clarity. Transmembrane segments S1–S6 are colored individually and labeled. The S4–S5 linker is colored purple. Side chains atoms of key residues in VSD are represented as in A. The narrow region of focused membrane electrical field at the hydrophobic constriction site is highlighted by orange bars.
Fig. P1.
Fig. P1.
Model of the voltage-sensing domain of NaChBac. Transmembrane view of the lowest-energy models of the voltage-sensing domain channel in Resting State 1 (Left) and Activated State 3 (Right). Side chains of the gating charge-carrying arginines in S4 and key residues in S1, S2, and S3 segments are shown in stick representation and labeled. Most models of Resting State 1 predict that R1 forms hydrogen bonds with a portion of S3. R3 makes ionic interactions with the intracellular negatively charged cluster, and R4 forms an ion pair with D93 (in S3). Activated State models predict various interactions among R1, R2, R3, R4, and the surrounding regions.

Similar articles

Cited by

References

    1. Hille B. Ion Channels of Excitable Membranes. 3rd Ed. Sunderland, MA: Sinauer; 2001.
    1. Catterall WA. From ionic currents to molecular mechanisms: The structure and function of voltage-gated sodium channels. Neuron. 2000;26:13–25. - PubMed
    1. Yu FH, Catterall WA. The VGL-chanome: A protein superfamily specialized for electrical signaling and ionic homeostasis. Sci STKE. 2004;2004:re15. - PubMed
    1. Ren D, et al. A prokaryotic voltage-gated sodium channel. Science. 2001;294:2372–2375. - PubMed
    1. Koishi R, et al. A superfamily of voltage-gated sodium channels in bacteria. J Biol Chem. 2004;279:9532–9538. - PubMed

Publication types

MeSH terms

LinkOut - more resources