. 2011 Dec 27;108(52):21241-6.
doi: 10.1073/pnas.1108261109. Epub 2011 Dec 12.

Experience-dependent regulation of CaMKII activity within single visual cortex synapses in vivo

Affiliations

Experience-dependent regulation of CaMKII activity within single visual cortex synapses in vivo

Amanda F Mower et al. Proc Natl Acad Sci U S A. .

Abstract

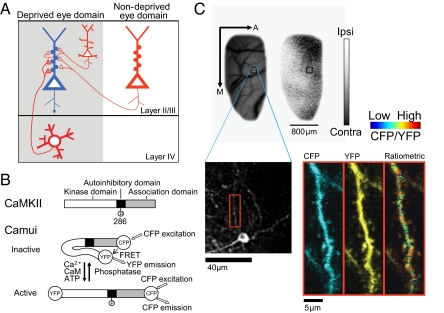
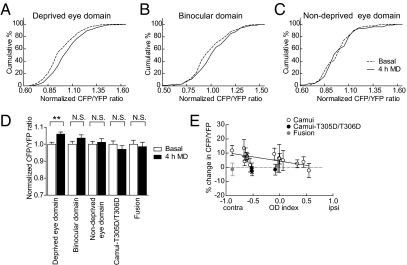
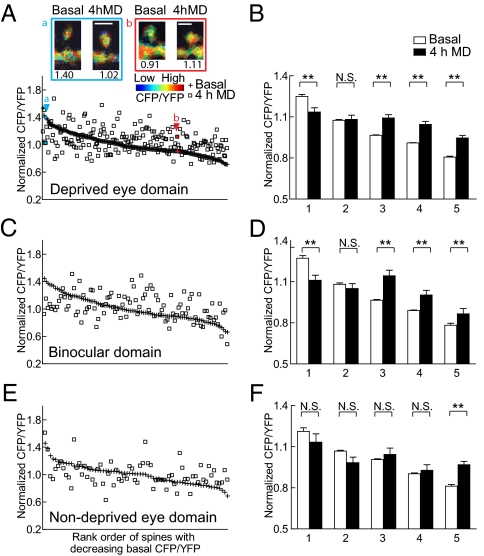
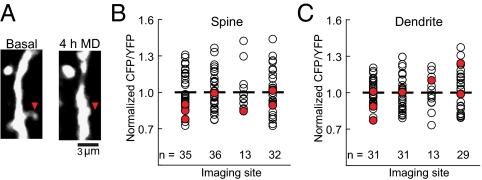
Unbalanced visual input during development induces persistent alterations in the function and structure of visual cortical neurons. The molecular mechanisms that drive activity-dependent changes await direct visualization of underlying signals at individual synapses in vivo. By using a genetically engineered Förster resonance energy transfer (FRET) probe for the detection of CaMKII activity, and two-photon imaging of single synapses within identified functional domains, we have revealed unexpected and differential mechanisms in specific subsets of synapses in vivo. Brief monocular deprivation leads to activation of CaMKII in most synapses of layer 2/3 pyramidal cells within deprived eye domains, despite reduced visual drive, but not in nondeprived eye domains. Synapses that are eliminated in deprived eye domains have low basal CaMKII activity, implying a protective role for activated CaMKII against synapse elimination.


Conflict of interest statement

The authors declare no conflict of interest.

Figures

Fig. 1.
Fig. 1.
Imaging of CaMKII activity in identified OD domains. (A) Schematic diagram of a sample pyramidal neuron (blue) in layer II/III within the deprived eye domain receiving inputs from multiple sources (red). Thick red triangles represent feedforward synapses. Other synapses derive from local and longer-range axons, including inputs from the nondeprived eye. (B) Top: Schematic drawing of the CaMKII protein. Bottom: Conformations of Camui in the inactive and active form. (C) Alignment of two-photon microscopic images with OD map. Blood vessel and OD maps were obtained using intrinsic signal optical imaging (Upper: A, anterior; M, medial). Gray scale indicates ODI (white, ipsilateral eye dominated; black, contralateral eye dominated). Blood vessels in low-magnification optical and two-photon microscopic images were used to align two-photon images (Lower) to OD domains. A dendritic segment (red box) is magnified (Right) and displayed as channel separated images (CFP and YFP) as well as a ratiometric image in intensity-modulated display mode, indicating the CFP/YFP ratio. Warm hue represents high CaMKII activity.
Fig. 2.
Fig. 2.
Changes in synaptic CaMKII activity in spines within different eye domains after 4 h MD. (AC) CaMKII activity of individual synapses in (A) deprived eye domains (ODI < −0.1, n = 201 spines from seven imaging sites), (B) binocular domains (−0.1 ≤ ODI ≤ 0.1, n = 99 spines from five imaging sites), and (C) nondeprived domains (ODI > 0.1, n = 70 spines from three imaging sites) before (basal) and after 4 h MD. CFP/YFP ratios of individual spines normalized to the average basal CFP/YFP ratio of all spines within the respective imaged cortical site are plotted. (D) Bars show mean values of data pooled from each site imaged in individual animals, including data from negative control constructs: Camui-T305D/T306D (n = 98 spines from three imaging sites) and C-Y fusion protein (n = 33 spines from two imaging sites). **P < 0.05 (KS test); N.S., nonsignificant. (E) Mean percent change in FRET within spines in each imaging site shown in AC, including negative control data sites pooled in D, plotted versus their respective ODI value (R = −0.65). Error bars represent SEM within each imaging site.
Fig. 3.
Fig. 3.
CaMKII activation increases in deprived domain spines with low to moderate basal CaMKII activity and decreases in spines with high basal CaMKII activity. (A) Bottom: Normalized basal CFP/YFP ratios from individual spines in the deprived eye domain are ranked and plotted in decreasing order along with their respective CFP/YFP ratio after 4 h MD. Top: Intensity modulated display images of a spine with high basal and lower CaMKII activity after 4 h MD (A) as well as a spine with low basal and higher CaMKII activity level after 4 h MD (B). Spines a and b are indicated by their respective arrowheads in the plot. CFP/YFP values of the spines are shown below their images. (Scale bar: 2 μm.) (B) Data from A were binned in 20% increments and the mean was plotted. Numbers 1–5 on the x axis denote the first to fifth bins (**P < 0.05, paired two-tailed t test). (A and B) n = 201 spines from seven imaging sites. (CF) Normalized spine CFP/YFP ratios in the binocular domain (C and D) and open eye domain (E and F) plotted in the same manner as A and B. (C and D) n = 99 spines from five imaging sites; (E and F) n = 70 spines from three imaging sites. Error bars represent SEM.
Fig. 4.
Fig. 4.
Spines that are lost following 4 h MD have low basal CaMKII activity. (A) Arrowhead shows a dendritic spine that was lost after 4 h MD. (B) Distribution of basal CaMKII activity in eliminated and spared spines. Circles represent basal CaMKII activity in individual spines grouped according to imaged cortical site. Only sites which contained eliminated spines are shown. Horizontal bars indicate the population mean CFP/YFP ratio of each imaged cortical site. Red circles indicate spines that were eliminated after 4 h MD. White circles indicate spines that persisted after 4 h MD (n indicates spine number, including spines that disappeared, in each imaged region; seven out of a total of 116 spines were eliminated). Eliminated spines have significantly lower basal CFP/YFP ratios (P < 0.05, two-tailed t test). (C) Basal CaMKII activity levels in dendritic regions adjacent to spines that were eliminated were not significantly different from the population mean of their imaging site, shown as in B (P > 0.05, two-tailed t test).
Fig. 5.
Fig. 5.
Basal CaMKII activity and changes in CaMKII activity following 4 h MD are not correlated with spine size. (A) Basal CFP/YFP ratio in individual spines plotted against spine width. (B) Percent change in CFP/YFP ratio in individual spines after 4 h MD plotted against spine width. Spines shown (n = 100) are from deprived eye sites with same image brightness.

References

    1. Mioche L, Singer W. Chronic recordings from single sites of kitten striate cortex during experience-dependent modifications of receptive-field properties. J Neurophysiol. 1989;62:185–197. - PubMed
    1. Freeman RD, Olson C. Brief periods of monocular deprivation in kittens: Effects of delay prior to physiological study. J Neurophysiol. 1982;47:139–150. - PubMed
    1. Trachtenberg JT, Trepel C, Stryker MP. Rapid extragranular plasticity in the absence of thalamocortical plasticity in the developing primary visual cortex. Science. 2000;287:2029–2032. - PMC - PubMed
    1. Tropea D, Van Wart A, Sur M. Molecular mechanisms of experience-dependent plasticity in visual cortex. Philos Trans R Soc Lond B Biol Sci. 2009;364:341–355. - PMC - PubMed
    1. Hensch TK. Critical period plasticity in local cortical circuits. Nat Rev Neurosci. 2005;6:877–888. - PubMed

Publication types

Substances

LinkOut - more resources