. 2011 Dec 27;108(52):21075-80.
doi: 10.1073/pnas.1118922109. Epub 2011 Dec 12.

Control of glucose homeostasis and insulin sensitivity by the Let-7 family of microRNAs

Affiliations

Control of glucose homeostasis and insulin sensitivity by the Let-7 family of microRNAs

Robert J A Frost et al. Proc Natl Acad Sci U S A. .

Abstract

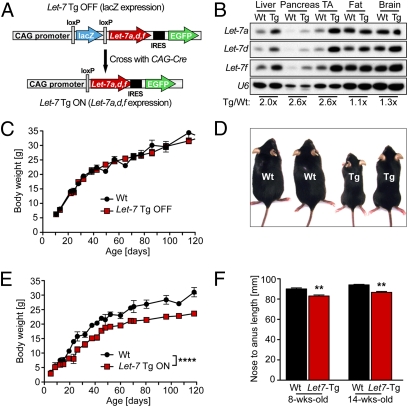
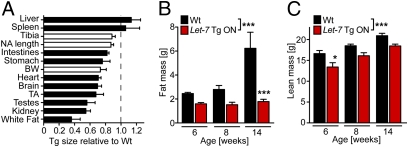
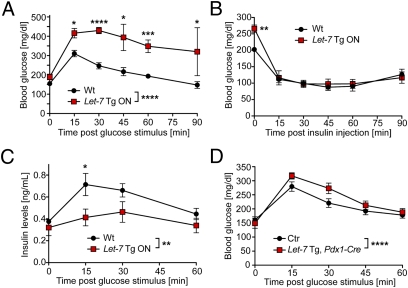
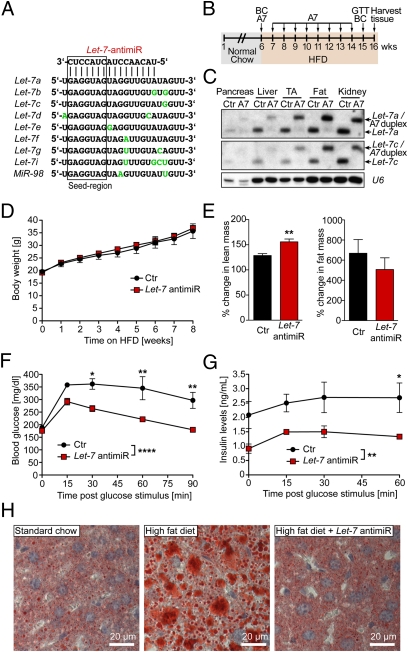
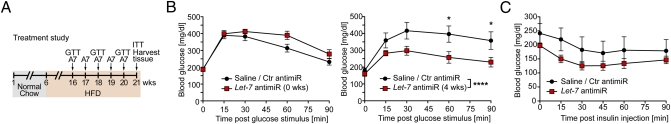
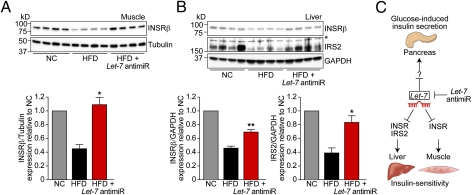
Diabetes mellitus is the most common metabolic disorder worldwide and a major risk factor for cardiovascular disease. MicroRNAs are negative regulators of gene expression that have been implicated in many biological processes, including metabolism. Here we show that the Let-7 family of microRNAs regulates glucose metabolism in multiple organs. Global and pancreas-specific overexpression of Let-7 in mice resulted in impaired glucose tolerance and reduced glucose-induced pancreatic insulin secretion. Mice overexpressing Let-7 also had decreased fat mass and body weight, as well as reduced body size. Global knockdown of the Let-7 family with an antimiR was sufficient to prevent and treat impaired glucose tolerance in mice with diet-induced obesity, at least in part by improving insulin sensitivity in liver and muscle. AntimiR treatment of mice on a high-fat diet also resulted in increased lean and muscle mass, but not increased fat mass, and prevented ectopic fat deposition in the liver. These findings demonstrate that Let-7 regulates multiple aspects of glucose metabolism and suggest antimiR-induced Let-7 knockdown as a potential treatment for type 2 diabetes mellitus. Furthermore, our Cre-inducible Let-7-transgenic mice provide a unique model for studying tissue-specific aspects of body growth and type 2 diabetes.


Conflict of interest statement

The authors declare no conflict of interest.

Figures

Fig. 1.
Fig. 1.
Global Let-7 overexpression results in reduced body weight and body size. (A) Let-7 transgene. The “inactive” construct (Let-7 Tg OFF) expresses lacZ globally under the control of the CAG promoter. After Cre mediated excision of the lacZ gene, the transgene expresses the chromosome 13 Let-7 cluster comprising Let-7a, Let-7d, and Let-7f. Global overexpression of Let-7 (Let-7 Tg ON) was achieved by crossing the Let-7 Tg OFF mice to CAG-Cre transgenic mice. Let-7 Tg ON mice were then back-crossed to C57BL/6 mice to obtain Let-7 Tg ON mice without the CAG-Cre transgene. Because of an internal ribosome entry site (IRES), Let-7 Tg ON mice should also express GFP; however, the expression level was too low to enable detection by fluorescence microscopy. (B) Total RNA was isolated from multiple organs of 4-wk-old WT (Wt) and Let-7 Tg ON mice and used for Northern blot analysis to detect Let-7a, Let-7d, and Let-7f expression. Detection of U6 was used as a loading control. The ratios of Let-7 expression in Tg vs. WT organs are shown beneath each pair of lanes. (C) Body weight of WT mice vs. Let-7 Tg OFF littermates at different ages. Values are mean ± SEM; n = 3–9 males per time point. (D) Two WT and two Let-7 Tg ON male littermates at age 6 wk. (E) Body weight of WT mice vs. Let-7 Tg ON littermates. Values are mean ± SEM; n = 3–14 males for each time point. ****P < 0.0001 for WT vs. Let-7 Tg ON by ANOVA with Bonferroni posttest. (F) Reduced body length in Let-7 Tg ON mice; n = 3 males per time point. **P < 0.01 for WT vs. Tg by ANOVA with Bonferroni posttest.
Fig. 2.
Fig. 2.
Reduced fat mass in Let-7 transgenic mice. (A) Relative organ weight or length [for tibia, nose-to-anus (NA) length, and intestine] of globally Let-7–expressing Tg mice vs. WT mice; n = 3. BW, body weight; TA, tibialis anterior; white fat, epididymal fat. (B and C) Body composition was measured in WT mice and Let-7 -Tg ON littermates at age 6, 8, and 14 wk by EchoMRI; n = 3 or 4 for each time point. *P < 0.05; ***P < 0.001 for WT vs. Let-7 Tg ON by ANOVA with Bonferroni posttest.
Fig. 3.
Fig. 3.
Impaired glucose tolerance in Let-7 transgenic mice. (A) A GTT was performed in 7-wk-old WT mice and Let-7 Tg ON littermates after a 7-h fast. Glucose levels were determined at baseline and at the indicated times after an i.p. glucose stimulus (1.5 mg/g body weight); n = 7 (3 for 45 min and 90 min). *P < 0.05; ***P < 0.001; ****P < 0.0001 for WT vs. Let-7 Tg ON by ANOVA with Bonferroni posttest. (B) An ITT was performed in 8-wk-old fed Let-7 Tg ON mice and WT littermates. Blood glucose levels were measured at baseline and 15, 30, 45, 60, and 90 min after i.p. injections of insulin (1.0 U/kg body weight); n = 7. **P < 0.01 for WT vs. Let-7 Tg at baseline by ANOVA with Bonferroni posttest. (C) 7-wk-old Let-7 Tg ON mice and WT littermates were fasted for 7 h and then received a glucose stimulus (1.5 mg/g body weight i.p.). Blood was collected at baseline and after glucose stimulation and used for determination of insulin levels by ELISA; n = 4. *P < 0.05; **P < 0.01 by ANOVA with Bonferroni posttest. (D) Let-7 Tg OFF mice were crossed to Pdx1-Cre mice to induce pancreas-restricted Let-7 overexpression. A GTT was performed in 6-wk-old offspring after a 7 h fast to determine blood glucose levels after i.p. glucose stimulation (1.5 mg/g body weight). n = 5; ****P < 0.0001 for control (WT, Pdx1-Cre Tg, or Let-7 Tg OFF) vs. Let-7 Tg, Pdx1-Cre by ANOVA with Bonferroni posttest.
Fig. 4.
Fig. 4.
AntimiR-induced repression of Let-7 expression prevents impaired glucose tolerance. (A) Sequences of the Let-7 family. Nucleotide differences to Let-7a are labeled with green. The box indicates the seed region (nucleotides 2–8). We designed a 16mer LNA-DNA antimiR with complimentarity to nucleotides 2–17 of Let-7a and Let-7c. (B) Design of the diabetes prevention study. The 6-wk-old C57BL/6 mice were maintained on an HFD and injected s.c. once weekly with saline as a control or a specifically designed Let-7 antimiR (A7; 20 mg/kg body weight) for 8 wk. At 1 wk after the last A7 injection, a GTT was performed. Body composition (BC) was measured before the onset of HFD and at 1 wk after the last A7 injection. Tissues were harvested at 2 wk after the last A7 injection. (C) Tissues were harvested at the end of the prevention study, which was 2 wk after the last Let-7 antimiR injection. Pooled total RNA of 4 Ctr and, respectively, antimiR-treated animals was used for Northern blot analysis to determine expression of Let-7 family members. An upshift of mature Let-7 was detected in tissues of Let-7-antimiR–treated mice, likely representing a Let-7/Let-7 antimiR duplex. U6 was used as a loading control. (D) Body weight was determined weekly during the prevention study. (E) Body composition was assessed before the initiation of the HFD and at 1 wk after the last Let-7 antimiR injection by EchoMRI. The percent changes in lean and fat mass during the study period are depicted. n = 4. **P < 0.01, t test. (F and G) A GTT was performed at 1 wk after the last Let-7 antimiR injection after a 7-h fast to determine blood glucose and insulin levels upon i.p. glucose stimulation (2 mg/g lean mass). (F) Blood glucose levels were measured at baseline and at 15, 30, 60, and 90 min after glucose stimulation. (G) For assessment of insulin levels, plasma was collected at baseline and at 15, 30, and 60 min after glucose stimulation. Consecutive insulin levels were determined by ELISA. *P < 0.05; **P < 0.01; ****P < 0.0001 for control vs. Let-7 antimiR–treated mice by ANOVA followed by Bonferroni posttest. (H) At the end of the prevention study, frozen liver sections were stained by Oil Red O to detect ectopic lipid deposition. Representative sections are shown.
Fig. 5.
Fig. 5.
AntimiR-induced repression of Let-7 expression improves impaired glucose tolerance. (A) Design of the diabetes treatment study. Six-wk-old C57BL/6 mice were fed for 10 wk with HFD. Subsequently, the mice were maintained on an HFD for 5 more wk, but half of the mice (n = 5) were treated with Let-7 antimiR (once weekly 20 mg/kg body weight) whereas control animals (Ctr) received either saline (n = 3) or control antimiR (n = 2). (B) GTTs (1.5 mg glucose/g body weight) were performed before initiation of antimiR treatment (Left) and at 4 wk after the first antimiR injection (Right). *P < 0.05; ****P < 0.0001 for Ctr (saline + control antimiR) vs. Let-7 antimiR– treated mice by ANOVA with Bonferroni posttest. (C) An ITT was performed at 1 wk after the last Let-7 antimiR injection. Blood glucose levels were measured at baseline and at 15, 30, 45, 60, and 90 min after i.p. insulin injection (1.0 U/kg body weight).
Fig. 6.
Fig. 6.
Let-7 regulates insulin signaling in liver and muscle. (A) Gastrocnemius muscle was harvested from mice at the end of the prevention study and from age-, sex-, and strain-matched mice fed with normal chow (NC). (Upper) Protein lysates from those mice were used to detect expression levels of the insulin receptor β (INSRβ) by Western blot analysis. Tubulin expression was used as a loading control. (Lower) Densitometric and statistical analysis. *P < 0.05 for HFD vs. HFD + Let-7 antimiR, t test. (B) Detection of INSRβ and insulin receptor substrate 2 (IRS2) by Western blot analysis of liver lysates from the same mice. GAPDH expression was used as loading control. The asterisk indicates an unspecific band detected by the IRS2 antibody. *P < 0.05; **P < 0.01 for HFD vs. HFD + Let-7 antimiR, t test. (C) Model of Let-7–induced modulation of glucose metabolism. Let-7 inhibits glucose-induced insulin secretion from pancreatic β-cells as demonstrated in Let-7 transgenic mice. In addition, antimiR knockdown of Let-7 improves insulin sensitivity in liver and muscle, at least in part by restoring expression levels of INSR and IRS2.

References

    1. World Health Organization Diabetes fact sheet no. 312. 2011. Available at http://www.who.int/mediacentre/factsheets/fs312/en/index.htmlAccessed August, 2011.
    1. McCarthy MI. Genomics, type 2 diabetes, and obesity. N Engl J Med. 2010;363:2339–2350. - PubMed
    1. McCarthy MI, Zeggini E. Genome-wide association studies in type 2 diabetes. Curr Diab Rep. 2009;9:164–171. - PMC - PubMed
    1. Barr EL, et al. Risk of cardiovascular and all-cause mortality in individuals with diabetes mellitus, impaired fasting glucose, and impaired glucose tolerance: The Australian Diabetes, Obesity, and Lifestyle Study (AusDiab) Circulation. 2007;116:151–157. - PubMed
    1. Sayed D, Abdellatif M. MicroRNAs in development and disease. Physiol Rev. 2011;91:827–887. - PubMed

Publication types