. 2012 Feb;25(2):47-57.
doi: 10.1093/protein/gzr056. Epub 2011 Dec 9.

Epidermal growth factor receptor downregulation by small heterodimeric binding proteins

Affiliations

Epidermal growth factor receptor downregulation by small heterodimeric binding proteins

Benjamin J Hackel et al. Protein Eng Des Sel. 2012 Feb.

Abstract

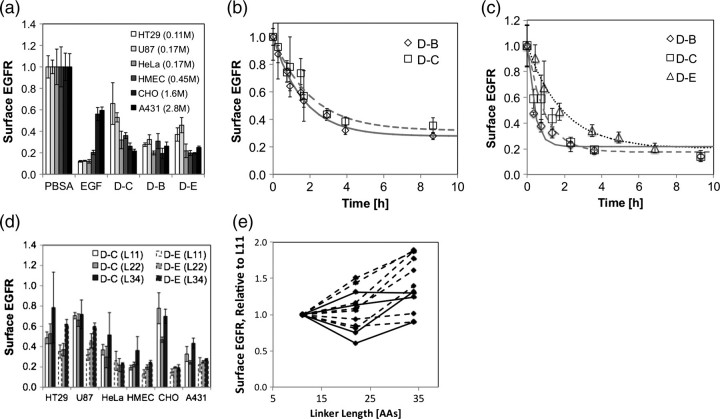
No single engineered protein has been shown previously to robustly downregulate epidermal growth factor receptor (EGFR), a validated cancer target. A panel of fibronectin-based domains was engineered to bind with picomolar to nanomolar affinity to multiple epitopes of EGFR. Monovalent and homo- and hetero-bivalent dimers of these domains were tested for EGFR downregulation. Selected orientations of non-competitive heterodimers decrease EGFR levels by up to 80% in multiple cell types, without activating receptor signaling. These heterodimers inhibit autophosphorylation, proliferation and migration, and are synergistic with the monoclonal antibody cetuximab in these activities. These small (25 kDa) heterodimers represent a novel modality for modulating surface receptor levels.


Figures

Fig. 1.
Fig. 1.
Epitope mapping of EGFR-binding Fn3 domains. A library of EGFR ectodomain mutants was sorted for clones that maintained binding to a conformational binder but had reduced binding to the indicated Fn3 domain. All single amino acid mutants, excluding proline and glycine mutants, are presented as spheres in the crystal structures of (a) the tethered monomer (1NQL; Ferguson et al., 2003) and (b) the ligand-bound dimer (1IVO; Ogiso et al., 2002). Mutations: clone A (red): L14H, Q16R, Y45F and H69(Q,R,Y); clone B (green): I327K, V350M, F352V and W386R; clone C (blue): I341V and E376K; clone D (yellow): K430E and S506R; clone E (magenta): T235M, F335I, V350M, A351T, F352L and T358A; clone F (cyan): K311N and I332T. Cetuximab is shown in (a) based on homology to the crystal structure of the EGFR/cetuximab complex (1YY9; Li et al., 2005). EGF is shown in orange in (b). Domains are labeled D1–D4.
Fig. 2.
Fig. 2.
EGFR downregulation. (a) Schematic of Fn3-Fn3 heterobivalent with the wild-type Fn3 structure from PDB ID 1TTG and the flexible linker drawn approximately to scale in cartoon form. (b) A431, HeLa and HT29 cells were cultured in 96-well plates, serum starved and treated with 20 nM of the indicated Fn3 or Fn3-Fn3 construct for 6–8 h. Surface EGFR was quantified by flow cytometry and is presented on a color scale relative to PBSA-treated control with black indicating no downregulation and white indicating complete downregulation. Mean of triplicate samples is used for quantification. (c) Data from (b) for select constructs with A431 cells. Error bars indicate standard deviation of triplicate samples. PBSA indicates PBS with bovine serum albumin.
Fig. 3.
Fig. 3.
Downregulation characterization. Cells were cultured in 96-well plates, serum starved and treated with 20 nM agent for 8 h unless noted. Surface EGFR was quantified by flow cytometry and normalized to PBSA-treated control. Values and error bars indicate the mean and standard deviation of triplicate samples. (a) Cell line and receptor density impact. Downregulation was quantified in six cell lines of varying EGFR levels. Parenthetical notation in legend indicates the number of EGFR per cell in million. (b, c) Downregulation kinetics. Downregulation was quantified at multiple time points in A431 (b) and HeLa (c) cells. Lines represent a theoretical fit of the data calculated by minimizing the sum of squared errors. (d) Linker length impact. The downregulation assay was performed with D-C (solid outline) and D-E (dashed outline) heterodimers with linkers of 11, 22 or 34 amino acids. (e) The data from (d) are summarized to compare linker lengths. Surface EGFR values are normalized for each combination and cell type. Dashed lines indicate cells with <1 million EGFR per cell. Solid lines indicate cells with >1 million EGFR per cell.
Fig. 4.
Fig. 4.
Intracellular effects of downregulation. (a) Downregulation of EGFR in HEK transfectants. HEK cells were transfected with an EGFR expression vector, grown and treated with 20 nM agent for 2 h (dashed outline) or 7 h (solid outline). Surface EGFR was quantified by flow cytometry and normalized to PBSA-treated control. Three conditions are shown: untransfected cells; untransfected cells in the presence of transfected cells, and transfected cells. (b) Downregulation of mutant EGFR. HEK cells were transfected with the indicated EGFR expression vector, grown and treated with 20 nM agent for 2 h. Surface EGFR was quantified by flow cytometry and normalized to PBSA-treated control. (c) EGFR phosphorylation. A431 cells were cultured in 96-well plates, serum-starved and treated with 20 nM agent for 5, 15, 60 or 240 min. Cells were fixed, permeabilized, labeled with rabbit anti-phosho-(S/T/Y) antibody followed by anti-rabbit-800CW and ToPro3 (to stain DNA) and imaged. (d) Proteomic phosphorylation. A431 cells were cultured in 12-well plates, serum starved and treated with 20 nM agent for 15 or 60 min. Cell lysates were reduced, alkylated, digested and labeled with iTRAQ isotopic labels. Peptides with phosphorylated tyrosines are isolated by polyclonal antibody affinity chromatography and analyzed by LC–MS/MS. Relative phosphorylation is quantified by comparison of isotopically related peaks. Top portion represents 15 highest responders to EGF treatment. Lower portion represents 15 highest responders to heterobivalent treatment.
Fig. 5.
Fig. 5.
Downstream effects of EGFR downregulation. (a) Inhibition of ERK phosphorylation. A431 cells were cultured in 24-well plates, serum starved and treated with 20 nM agent for 6 h. Cells were then treated with 1 nM EGF for 15 min. Cell lysates were separated by SDS–PAGE, blotted to nitrocellulose, and labeled with rabbit anti-phosphoERK1/2 Y202/Y204 antibody followed by peroxidase-conjugated anti-rabbit antibody and imaged. (b) Inhibition of proliferation. hMEC cells with autocrine EGF signaling were cultured in 96-well plates and treated with 20 nM of the indicated agent(s). Additional agent is added after 48 h. Viability is quantified using AlamarBlue and normalized independently for both time points relative to PBSA-treated cells. – or + indicates the absence or presence of 225 antibody. (c) EGFR downregulation with Fn3-Fn3 and 225. A431, HeLa and HT29 cells were cultured, serum starved and treated with 20 nM 225 and 20 nM of the indicated Fn3 or Fn3-Fn3 construct for 6–8 h. Surface EGFR was quantified by flow cytometry and is presented on an intensity scale relative to PBSA-treated control with black indicating no downregulation and white indicating complete downregulation. (d, e) Inhibition of migration. Cells (TCT in (d), as indicated in (e)) were cultured in 96-well plates to a confluent monolayer. A ‘wound’ was scratched into each monolayer to create a void of cells. Cells were treated with 20 nM of the indicated agent(s). Migration was analyzed by microscopy. – or + indicates the absence or presence of 225 antibody. Multiple ‘wounds’ treated with PBSA were completely healed, thus limiting measurable migration. ND indicates no data.

References

    1. Ackerman M., Levary D., Tobon G., et al. Biotechnol Prog. 2009;25:774–783. - PMC - PubMed
    1. Amos S., Martin P.M., Polar G.A., et al. J Biol Chem. 2005;280:7729–7738. - PMC - PubMed
    1. Bao J., Alroy I., Waterman H., et al. J Biol Chem. 2000;275:26178–26186. - PubMed
    1. Ben-Kasus T., Schechter B., Lavi S., et al. Proc Natl Acad Sci USA. 2009;106:3294–3299. - PMC - PubMed
    1. Biscardi J.S., Maa M.C., Tice D.A., et al. J Biol Chem. 1999;274:8335–8343. - PubMed

Publication types

MeSH terms