

Spontaneous transformation of murine epithelial cells requires the early acquisition of specific chromosomal aneuploidies and genomic imbalances
- PMID: 22161874
- PMCID: PMC3276700
- DOI: 10.1002/gcc.21921
Spontaneous transformation of murine epithelial cells requires the early acquisition of specific chromosomal aneuploidies and genomic imbalances
Abstract
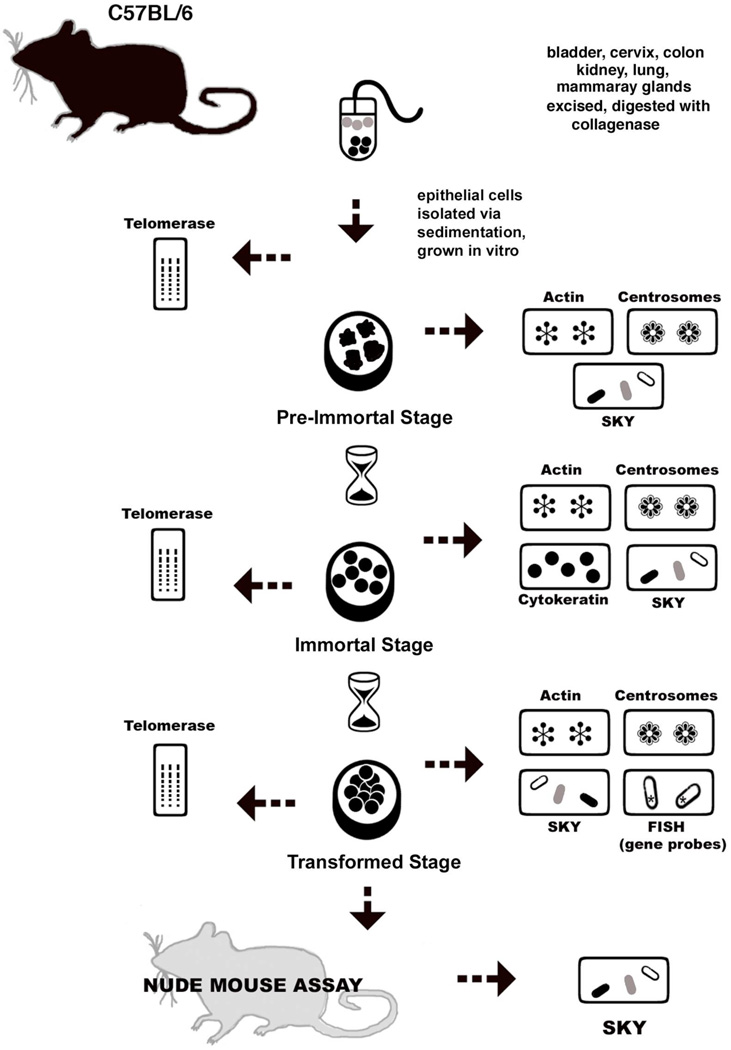
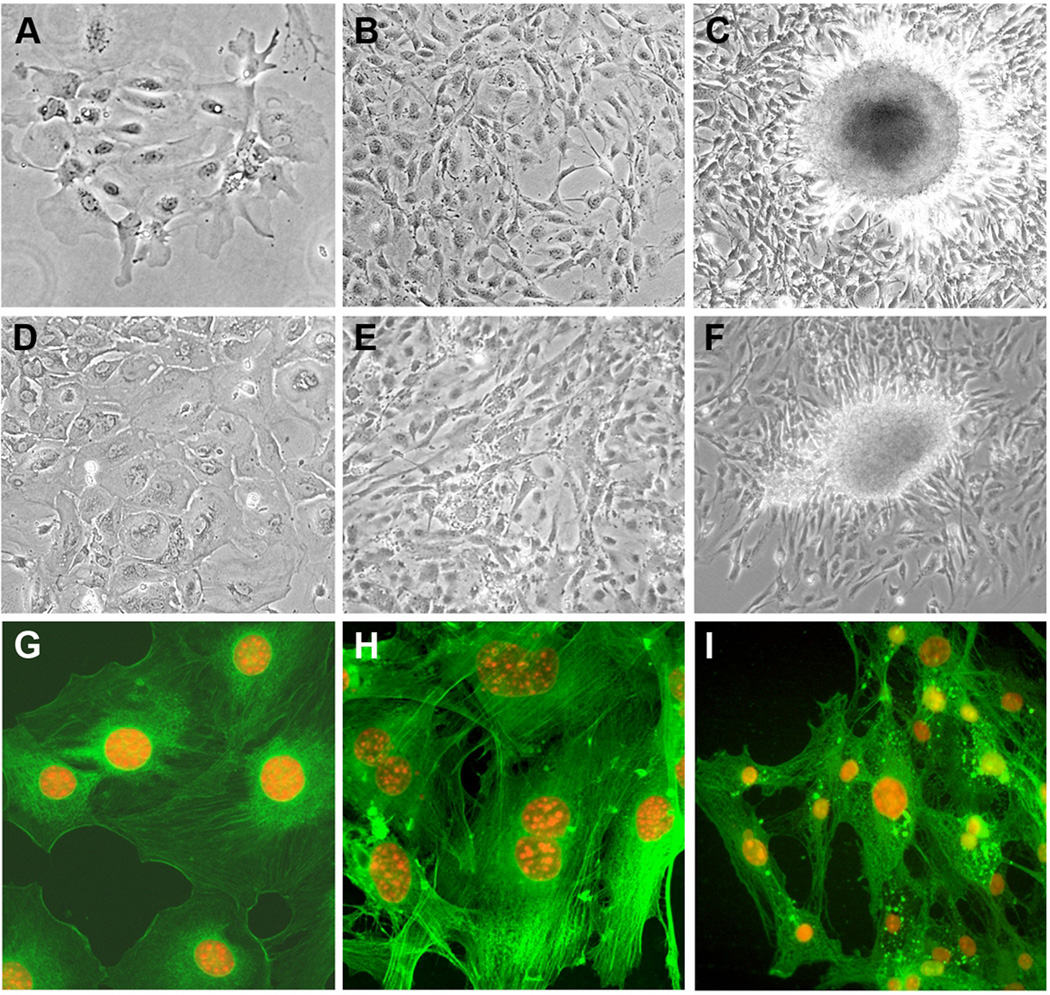
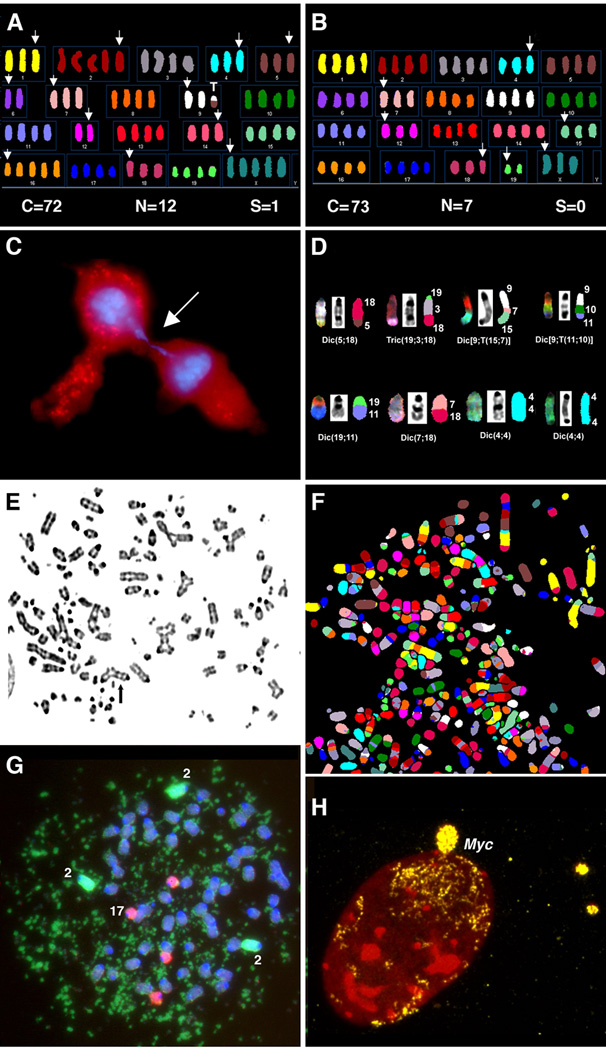
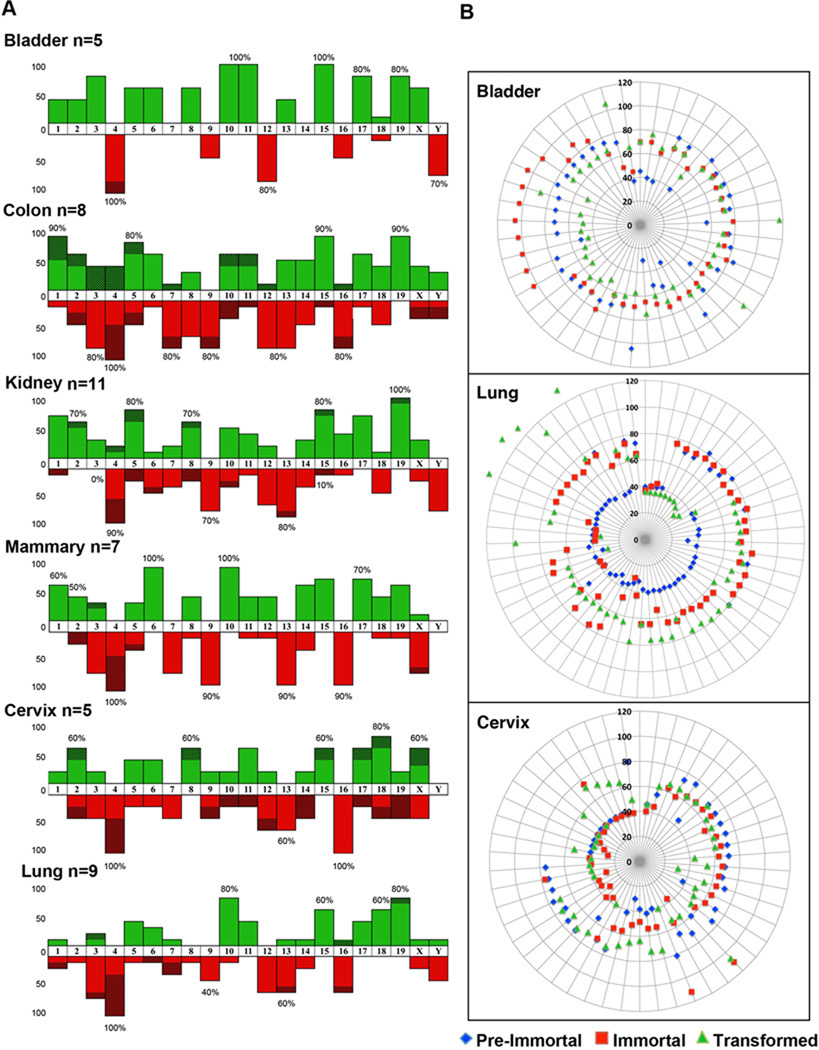
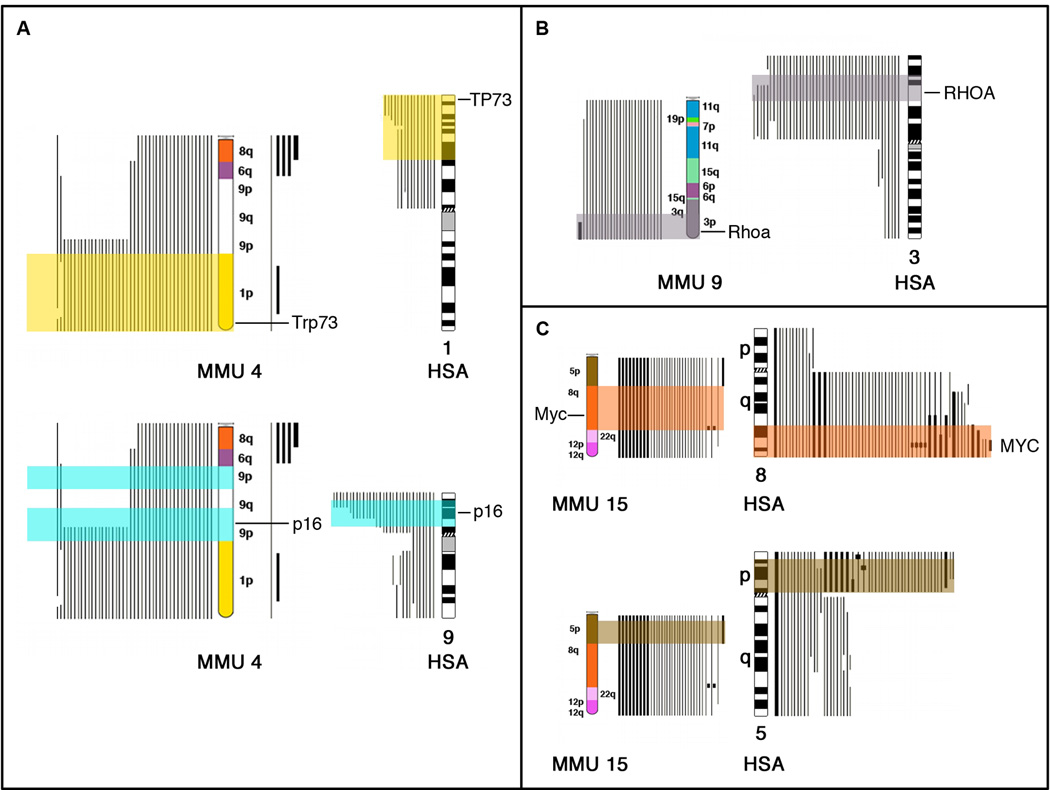
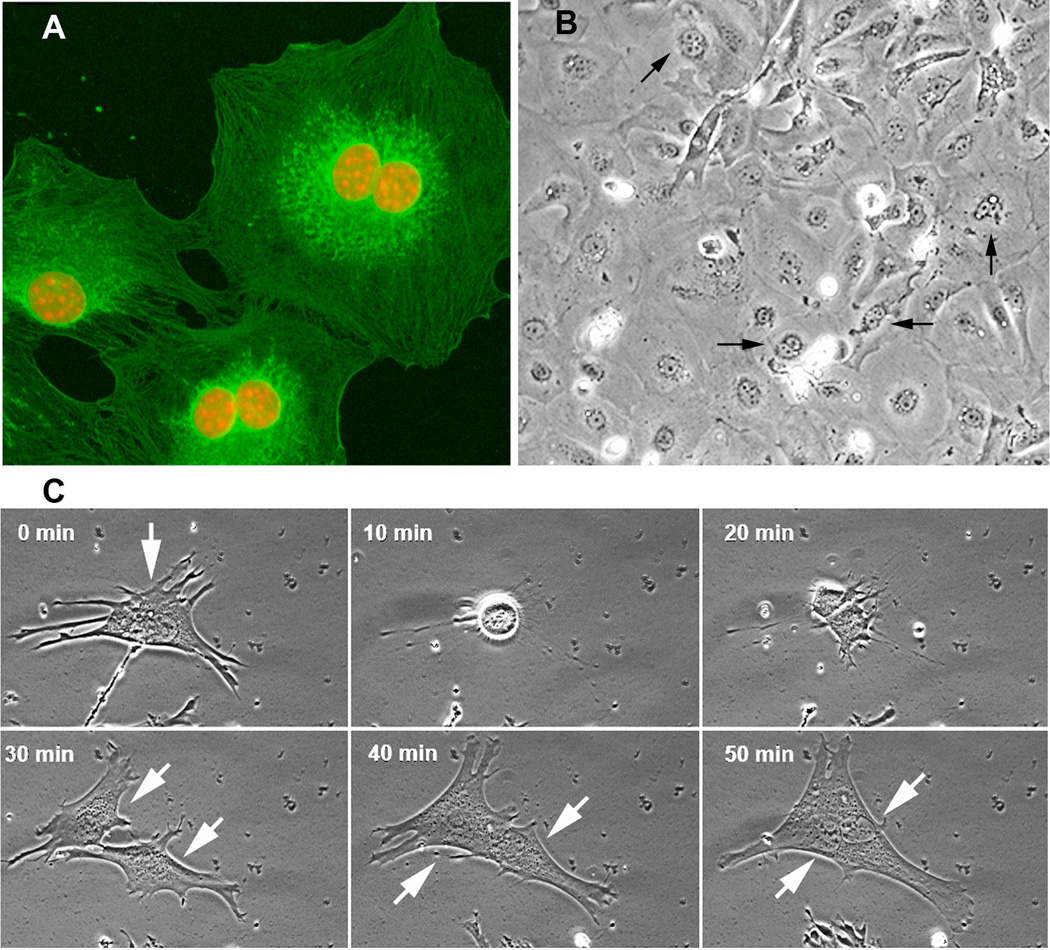
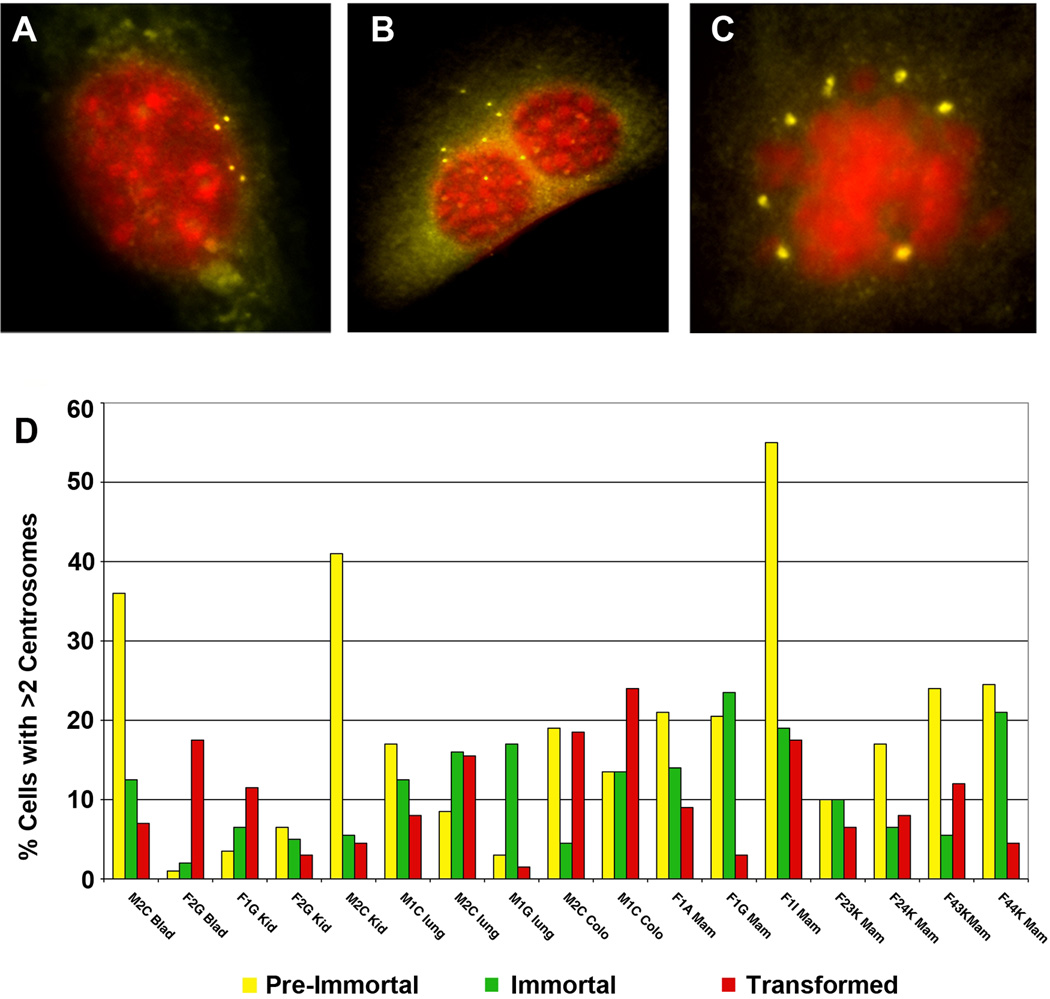
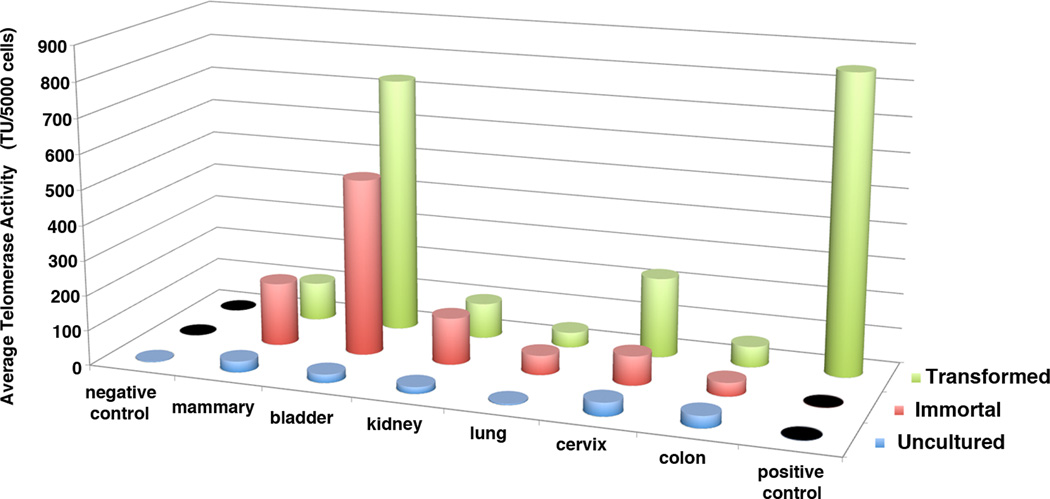
Human carcinomas are defined by recurrent chromosomal aneuploidies, which result in a tissue-specific distribution of genomic imbalances. In order to develop models for these genome mutations and to determine their role in tumorigenesis, we generated 45 spontaneously transformed murine cell lines from normal epithelial cells derived from bladder, cervix, colon, kidney, lung, and mammary gland. Phenotypic changes, chromosomal aberrations, centrosome number, and telomerase activity were assayed in control uncultured cells and in three subsequent stages of transformation. Supernumerary centrosomes, binucleate cells, and tetraploidy were observed as early as 48 hr after explantation. In addition, telomerase activity increased throughout progression. Live-cell imaging revealed that failure of cytokinesis, not cell fusion, promoted genome duplication. Spectral karyotyping demonstrated that aneuploidy preceded immortalization, consisting predominantly of whole chromosome losses (4, 9, 12, 13, 16, and Y) and gains (1, 10, 15, and 19). After transformation, focal amplifications of the oncogenes Myc and Mdm2 were frequently detected. Fifty percent of the transformed lines resulted in tumors on injection into immunocompromised mice. The phenotypic and genomic alterations observed in spontaneously transformed murine epithelial cells recapitulated the aberration pattern observed during human carcinogenesis. The dominant aberration of these cell lines was the presence of specific chromosomal aneuploidies. We propose that our newly derived cancer models will be useful tools to dissect the sequential steps of genome mutations during malignant transformation, and also to identify cancer-specific genes, signaling pathways, and the role of chromosomal instability in this process.
Copyright © 2011 Wiley Periodicals, Inc.
Figures
Similar articles
-
Aneuploidy, oncogene amplification and epithelial to mesenchymal transition define spontaneous transformation of murine epithelial cells.Carcinogenesis. 2013 Aug;34(8):1929-39. doi: 10.1093/carcin/bgt138. Epub 2013 Apr 25. Carcinogenesis. 2013. PMID: 23619298 Free PMC article.
-
Novel mouse model recapitulates genome and transcriptome alterations in human colorectal carcinomas.Genes Chromosomes Cancer. 2017 Mar;56(3):199-213. doi: 10.1002/gcc.22426. Epub 2016 Nov 1. Genes Chromosomes Cancer. 2017. PMID: 27750367 Free PMC article.
-
Simultaneous Aurora-A/STK15 overexpression and centrosome amplification induce chromosomal instability in tumour cells with a MIN phenotype.BMC Cancer. 2007 Nov 13;7:212. doi: 10.1186/1471-2407-7-212. BMC Cancer. 2007. PMID: 17999753 Free PMC article.
-
Deregulation of the centrosome cycle and the origin of chromosomal instability in cancer.Adv Exp Med Biol. 2005;570:393-421. doi: 10.1007/1-4020-3764-3_14. Adv Exp Med Biol. 2005. PMID: 18727509 Review.
-
The consequences of chromosomal aneuploidy on the transcriptome of cancer cells.Biochim Biophys Acta. 2012 Jul;1819(7):784-93. doi: 10.1016/j.bbagrm.2012.02.020. Epub 2012 Mar 6. Biochim Biophys Acta. 2012. PMID: 22426433 Free PMC article. Review.
Cited by
-
Widespread Non-Canonical Epigenetic Modifications in MMTV-NeuT Breast Cancer.Neoplasia. 2015 Apr;17(4):348-57. doi: 10.1016/j.neo.2015.02.006. Neoplasia. 2015. PMID: 25925377 Free PMC article.
-
ATM deficiency promotes development of murine B-cell lymphomas that resemble diffuse large B-cell lymphoma in humans.Blood. 2015 Nov 12;126(20):2291-301. doi: 10.1182/blood-2015-06-654749. Epub 2015 Sep 23. Blood. 2015. PMID: 26400962 Free PMC article.
-
SMYD5 Controls Heterochromatin and Chromosome Integrity during Embryonic Stem Cell Differentiation.Cancer Res. 2017 Dec 1;77(23):6729-6745. doi: 10.1158/0008-5472.CAN-17-0828. Epub 2017 Sep 26. Cancer Res. 2017. PMID: 28951459 Free PMC article.
-
Aneuploidy, oncogene amplification and epithelial to mesenchymal transition define spontaneous transformation of murine epithelial cells.Carcinogenesis. 2013 Aug;34(8):1929-39. doi: 10.1093/carcin/bgt138. Epub 2013 Apr 25. Carcinogenesis. 2013. PMID: 23619298 Free PMC article.
-
Immunosurveillance against tetraploidization-induced colon tumorigenesis.Cell Cycle. 2013 Feb 1;12(3):473-9. doi: 10.4161/cc.23369. Epub 2013 Jan 16. Cell Cycle. 2013. PMID: 23324343 Free PMC article.
References
-
- Acilan C, Saunders WS. A tale of too many centrosomes. Cell. 2008;134:572–575. - PubMed
-
- Adessi GL, Beck L, Mahfoudi A. A model of glandular epithelium for studying secretion. In: Shaw AJ, editor. Epithelial Cell Culture: A Practical Approach. Oxford: Oxford University Press; 1996. pp. 135–156.
-
- Albertson DG, Collins C, McCormick F, Gray JW. Chromosome aberrations in solid tumors. Nat Genet. 2003;34:369–376. - PubMed
-
- Andersson S, Sowjanya P, Wangsa D, Hjerpe A, Johansson B, Auer G, Gravitt PE, Larsson C, Wallin KL, Ried T, Heselmeyer-Haddad K. Detection of genomic amplification of the human telomerase gene TERC, a potential marker for triage of women with HPV-positive, abnormal Pap smears. Am J Pathol. 2009;175:1831–1847. - PMC - PubMed
-
- Artandi SE, Chang S, Lee SL, Alson S, Gottlieb GJ, Chin L, DePinho RA. Telomere dysfunction promotes non-reciprocal translocations and epithelial cancers in mice. Nature. 2000;406:641–645. - PubMed
Publication types
MeSH terms
Substances
Grants and funding
LinkOut - more resources
Full Text Sources
Research Materials
