. 2012 Sep;68(3):762-71.
doi: 10.1002/mrm.23294. Epub 2011 Dec 9.

Simultaneous measurement of cerebral blood flow and transit time with turbo dynamic arterial spin labeling (Turbo-DASL): application to functional studies

Affiliations

Simultaneous measurement of cerebral blood flow and transit time with turbo dynamic arterial spin labeling (Turbo-DASL): application to functional studies

Yuguang Meng et al. Magn Reson Med. 2012 Sep.

Abstract

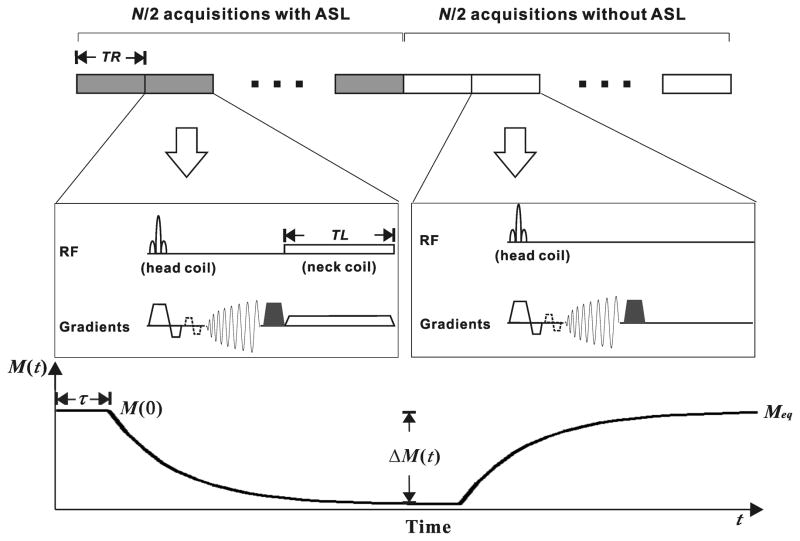
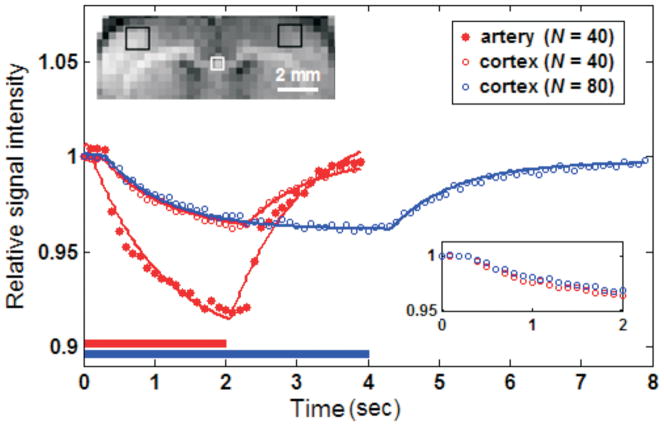
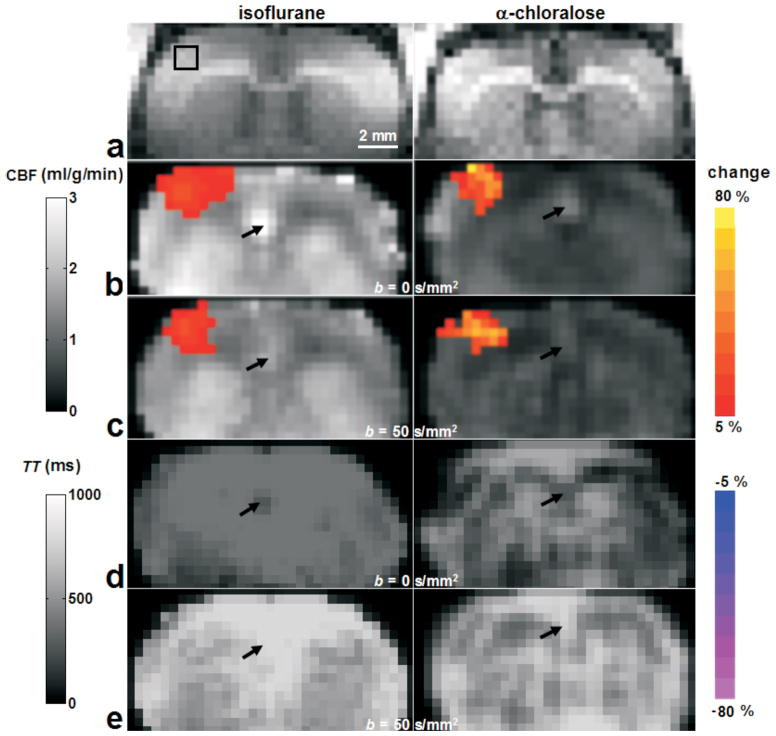
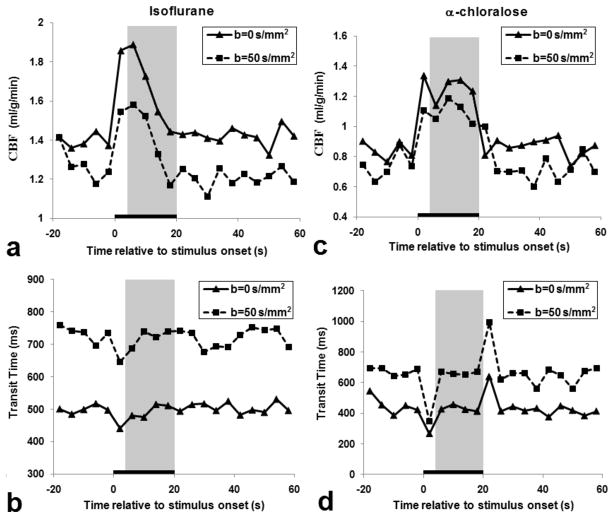
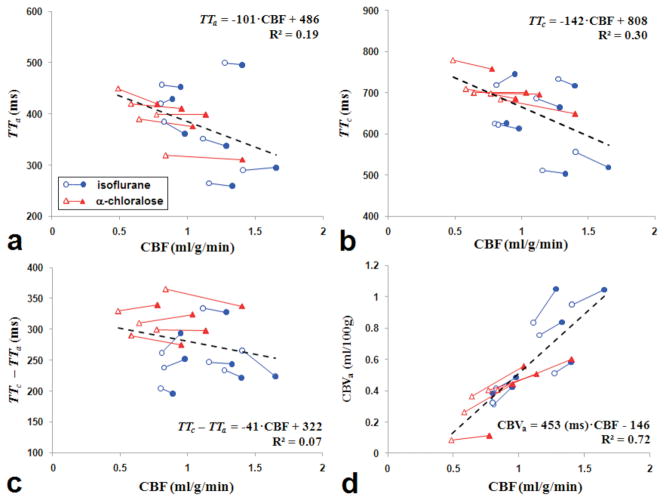
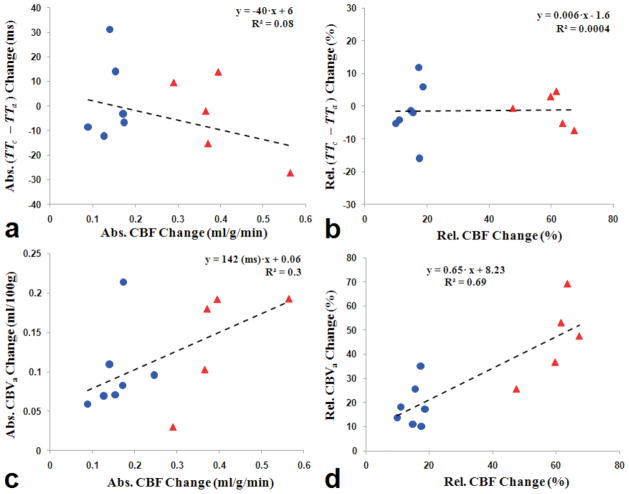
A turbo dynamic arterial spin labeling method (Turbo-DASL) was developed to simultaneously measure cerebral blood flow (CBF) and blood transit time with high temporal resolution. With Turbo-DASL, images were repeatedly acquired with a spiral readout after small-angle excitations during pseudocontinuous arterial spin labeling and control periods. Turbo-DASL experiments at 9.4 T without and with diffusion gradients were performed on rats anesthetized with isoflurane or α-chloralose. We determined blood transit times from carotid arteries to cortical arterial vessels (TT(a) ) from data obtained without diffusion gradients and to capillaries (TT(c) ) from data obtained with diffusion gradients. Cerebral arterial blood volume (CBV(a) ) was also calculated. At the baseline condition, both CBF and CBV(a) in the somatosensory cortical area were 40-50% less in rats with α-chloralose than in rats with isoflurane, while TT(a) and TT(c) were similar for both anesthetics. Absolute CBF and CBV(a) were positively correlated, while CBF and TT(c) were slightly negatively correlated. During forepaw stimulation, CBF increase was 15 ± 3% (n = 7) vs. 60 ± 7% (n = 5), and CBV(a) increase was 19 ± 9% vs. 46 ± 17% under isoflurane vs. α-chloralose anesthesia, respectively; CBF vs. CBV(a) changes were highly correlated. However, TT(a) and TT(c) were not significantly changed during stimulation. Our results support that arterial CBV increase plays a major role in functional CBF changes.


Figures

Figure 1
Figure 1
Schematic diagrams of the Turbo-DASL pulse sequence (top) and the expected signal response (bottom). A cycle of N images with repetition time (TR) consists of N/2 acquisitions with ASL and the other N/2 without ASL. Spiral data collection is applied after a low flip angle excitation RF pulse for obtaining short-TE images, and followed by a magnetization-dephasing gradient pulse (filled trapezoid). Diffusion gradients (dashed trapezoids) are optionally applied to eliminate arterial blood signal and to measure blood transit time to capillaries. Arterial spin labeling pulse with labeling time (TL) is applied using a neck labeling coil along with z-axis gradient around the carotid arteries. The signal M(t) varies with respect to time t. τ is the cerebral blood transit time from the carotid arteries to vasculature in the imaging slice, and M(0) and Meq are the signal intensities at t = 0 and steady-state in the presence of repetitive excitations, respectively. ΔM(t) is the signal difference between labeling and control periods with respect to time t.
Figure 2
Figure 2
Regional MR signals during one averaged Turbo-DASL cycle acquired with different imaging parameters without diffusion gradients, from one isoflurane-anesthetized animal. Turbo-DASL data were obtained from somatosensory cortex regions (black boxes in the inset image) and artery-containing ROI (white box), and were fitted with Eq. [1] (see solid lines). The single-compartment model fits very well to the cortical data, but not to data containing significant signal from large arteries. Bars underneath Turbo-DASL time courses indicate ASL durations. Inset time courses show 0 to 2 s data points of the somatosensory ROI for better visualization.
Figure 3
Figure 3
Baseline and functional Turbo-DASL results from two rats, anesthetized with isoflurane (left) and α-chloralose (right). Gray scale background maps (except the anatomical T1-weighted image a) were quantitative CBF values obtained without and with diffusion gradients (b and c, respectively), and TT values without and with diffusion gradients (d and e, respectively). Color maps overlaid on baseline images were percent changes of active pixels responding to forepaw stimulation. On the anatomical T1-weighted images (a), the black box indicates the 3×3 pixel ROI in the contralateral area, which will be used for further data analysis. Arrows indicate one large arterial vessel region, where the diffusion gradient of 50 s/mm2 changed the computed baseline CBF and TT.
Figure 4
Figure 4
Time courses of CBF and transit time in the contralateral somatosensory ROI from two rats shown in Figure 3 under isoflurane (a, b) and α-chloralose (c, d) anesthesia, measured without (b = 0 s/mm2) and with diffusion gradients (b = 50 s/mm2). The black bar indicates the 20 s stimulus period, while the gray-highlighted region indicates the stimulation time period (i.e., 4–20 s) used for further data analysis in Figures 5–6 and Table 1.
Figure 5
Figure 5
Inter-animal relationships between physiological parameters obtained from Turbo-DASL data. CBF values measured with diffusion gradients (b = 50 s/mm2) at baseline (open symbols) and stimulation (filled symbols) in each animal (connected line) were plotted against corresponding TTa (a), TTc (b), TTcTTa (c), and CBVa (d). Blue circles with blue lines and red triangles with red lines represent data measured from animals anesthetized with isoflurane and α-chloralose, respectively. The dash lines show a linear fit for all points on each plot. When CBVa is linearly correlated with CBF (d) with zero intercept, CBVa (ml/100g) = 320 (ms) · CBF (ml/100g/min).
Figure 6
Figure 6
Absolute (Abs.) and relative (Rel.) functional changes in CBF vs. TTcTTa (a and b), and CBF vs. CBVa (c and d). CBF values were measured with diffusion gradients (b = 50 s/mm2). Blue circles and red triangles represent data obtained from isoflurane and α-chloralose anesthetized rats, respectively. The dash lines show a linear fit for all points on each plot. When functional CBF vs. CBVa relationship was obtained with zero intercept, ΔCBVa (ml/100g) = 244 (ms) · ΔCBF (ml/100g/min) and ΔCBVa (%) = 0.82 · ΔCBF (%).

References

    1. Williams DS, Detre JA, Leigh JS, Koretsky AP. Magnetic resonance imaging of perfusion using spin inversion of arterial water. Proc Natl Acad Sci USA. 1992;89:212–216. - PMC - PubMed
    1. Kim SG. Quantification of relative cerebral blood flow change by flow-sensitive alternating inversion recovery (FAIR) technique: application to functional mapping. Magn Reson Med. 1995;34:293–301. - PubMed
    1. Edelman RR, Chen Q. EPISTAR MRI: multislice mapping of cerebral blood flow. Magn Reson Med. 1998;40:800–805. - PubMed
    1. Wong EC, Buxton RB, Frank LR. Quantitative imaging of perfusion using a single subtraction (QUIPSS and QUIPSS II) Magn Reson Med. 1998;39:702–708. - PubMed
    1. Alsop DC, Detre JA. Reduced transit-time sensitivity in noninvasive magnetic resonance imaging of human cerebral blood flow. J Cereb Blood Flow Metab. 1996;16:1236–1249. - PubMed

Publication types