

Divergent RNA-binding proteins, DAZL and VASA, induce meiotic progression in human germ cells derived in vitro
- PMID: 22162380
- PMCID: PMC3695740
- DOI: 10.1002/stem.1012
Divergent RNA-binding proteins, DAZL and VASA, induce meiotic progression in human germ cells derived in vitro
Abstract
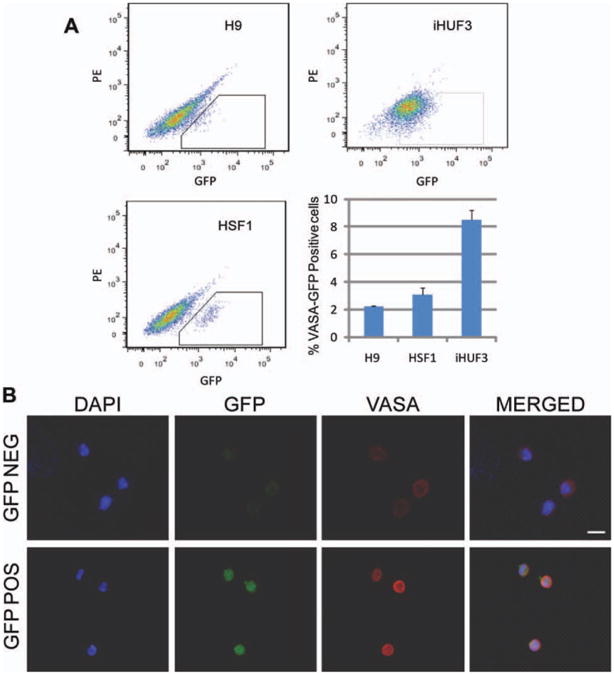
Our understanding of human germ cell development is limited in large part due to inaccessibility of early human development to molecular genetic analysis. Pluripotent human embryonic stem cells (hESCs) and induced pluripotent stem cells (iPSCs) have been shown to differentiate to cells of all three embryonic germ layers, as well as germ cells in vitro, and thus may provide a model for the study of the genetics and epigenetics of human germline. Here, we examined whether intrinsic germ cell translational, rather than transcriptional, factors might drive germline formation and/or differentiation from human pluripotent stem cells in vitro. We observed that, with overexpression of VASA (DDX4) and/or DAZL (Deleted in Azoospermia Like), both hESCs and iPSCs differentiated to primordial germ cells, and maturation and progression through meiosis was enhanced. These results demonstrate that evolutionarily unrelated and divergent RNA-binding proteins can promote meiotic progression of human-derived germ cells in vitro. These studies describe an in vitro model for exploring specifics of human meiosis, a process that is remarkably susceptible to errors that lead to different infertility-related diseases.
Copyright © 2011 AlphaMed Press.
Conflict of interest statement
Figures


Similar articles
-
Human germ cell differentiation from fetal- and adult-derived induced pluripotent stem cells.Hum Mol Genet. 2011 Feb 15;20(4):752-62. doi: 10.1093/hmg/ddq520. Epub 2010 Dec 3. Hum Mol Genet. 2011. PMID: 21131292 Free PMC article.
-
Exogenous supplementation of Activin A enhances germ cell differentiation of human embryonic stem cells.Mol Hum Reprod. 2015 May;21(5):410-23. doi: 10.1093/molehr/gav004. Epub 2015 Jan 29. Mol Hum Reprod. 2015. PMID: 25634576
-
Deleted in azoospermia-like enhances in vitro derived porcine germ cell formation and meiosis.Stem Cells Dev. 2013 Mar 15;22(6):939-50. doi: 10.1089/scd.2012.0323. Epub 2012 Dec 21. Stem Cells Dev. 2013. PMID: 23259838 Free PMC article.
-
The Beginning of Meiosis in Mammalian Female Germ Cells: A Never-Ending Story of Intrinsic and Extrinsic Factors.Int J Mol Sci. 2022 Oct 20;23(20):12571. doi: 10.3390/ijms232012571. Int J Mol Sci. 2022. PMID: 36293427 Free PMC article. Review.
-
Evolving Lessons on Metazoan Primordial Germ Cells in Diversity and Development.Mol Reprod Dev. 2025 May;92(5):e70027. doi: 10.1002/mrd.70027. Mol Reprod Dev. 2025. PMID: 40349219 Free PMC article. Review.
Cited by
-
Differential Expression of Anti-Inflammatory RNA Binding Proteins in Lupus Nephritis.Life (Basel). 2022 Sep 23;12(10):1474. doi: 10.3390/life12101474. Life (Basel). 2022. PMID: 36294909 Free PMC article.
-
Induction of goat bone marrow mesenchymal stem cells into putative male germ cells using mRNA for STRA8, BOULE and DAZL.Cytotechnology. 2019 Apr;71(2):563-572. doi: 10.1007/s10616-019-00304-7. Epub 2019 Feb 14. Cytotechnology. 2019. PMID: 30767091 Free PMC article.
-
The putative promoters of germ cell-specific genes and Nanog are hypomethylated in chicken sperm.J Reprod Dev. 2014;60(3):224-9. doi: 10.1262/jrd.2014-010. Epub 2014 Mar 16. J Reprod Dev. 2014. PMID: 24632725 Free PMC article.
-
Spermatogenic failure and the Y chromosome.Hum Genet. 2017 May;136(5):637-655. doi: 10.1007/s00439-017-1793-8. Epub 2017 Apr 29. Hum Genet. 2017. PMID: 28456834 Review.
-
Gene expression profiling of human oocytes developed and matured in vivo or in vitro.Biomed Res Int. 2013;2013:879489. doi: 10.1155/2013/879489. Epub 2013 Feb 20. Biomed Res Int. 2013. PMID: 23509795 Free PMC article. Review.
References
-
- Lawson KA, Hage WJ. Clonal analysis of the origin of primordial germ cells in the mouse. Ciba Found Symp. 1994;182:68–84. - PubMed
-
- Ginsburg M, Snow MH, McLaren A. Primordial germ cells in the mouse embryo during gastrulation. Development. 1990;110:521–528. - PubMed
-
- Hayashi K, de Sousa Lopes SM, Surani MA. Germ cell specification in mice. Science. 2007;316:394–396. - PubMed
-
- Saitou M, Barton SC, Surani MA. A molecular programme for the specification of germ cell fate in mice. Nature. 2002;418:293–300. - PubMed
-
- Geijsen N, Horoschak M, Kim K, et al. Derivation of embryonic germ cells and male gametes from embryonic stem cells. Nature. 2004;427:148–154. - PubMed
Publication types
MeSH terms
Substances
Grants and funding
LinkOut - more resources
Full Text Sources
Other Literature Sources
