. 2011:17:3034-54.
Epub 2011 Nov 23.

Next-generation sequencing facilitates quantitative analysis of wild-type and Nrl(-/-) retinal transcriptomes

Affiliations

Next-generation sequencing facilitates quantitative analysis of wild-type and Nrl(-/-) retinal transcriptomes

Matthew J Brooks et al. Mol Vis. 2011.

Abstract

Purpose: Next-generation sequencing (NGS) has revolutionized systems-based analysis of cellular pathways. The goals of this study are to compare NGS-derived retinal transcriptome profiling (RNA-seq) to microarray and quantitative reverse transcription polymerase chain reaction (qRT-PCR) methods and to evaluate protocols for optimal high-throughput data analysis.

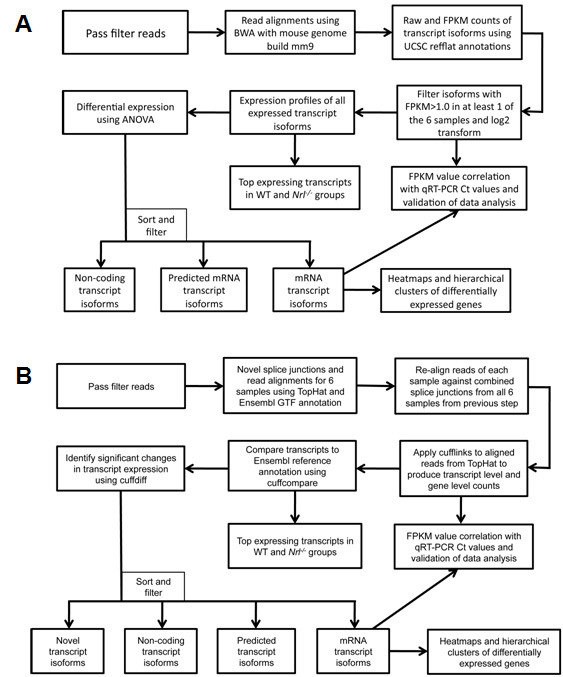
Methods: Retinal mRNA profiles of 21-day-old wild-type (WT) and neural retina leucine zipper knockout (Nrl(-/-)) mice were generated by deep sequencing, in triplicate, using Illumina GAIIx. The sequence reads that passed quality filters were analyzed at the transcript isoform level with two methods: Burrows-Wheeler Aligner (BWA) followed by ANOVA (ANOVA) and TopHat followed by Cufflinks. qRT-PCR validation was performed using TaqMan and SYBR Green assays.

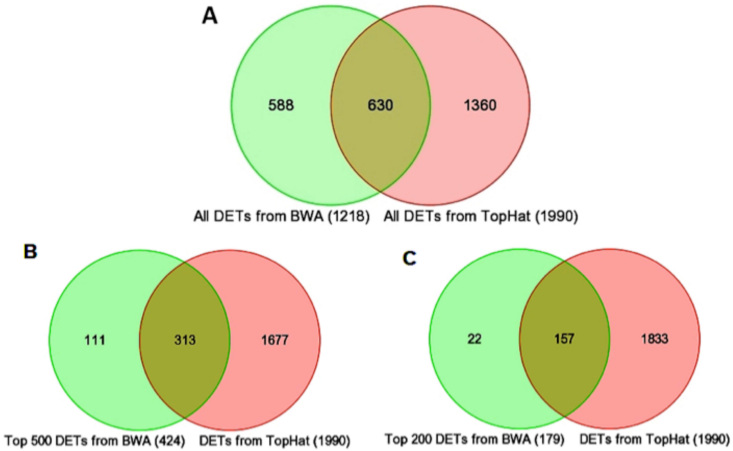
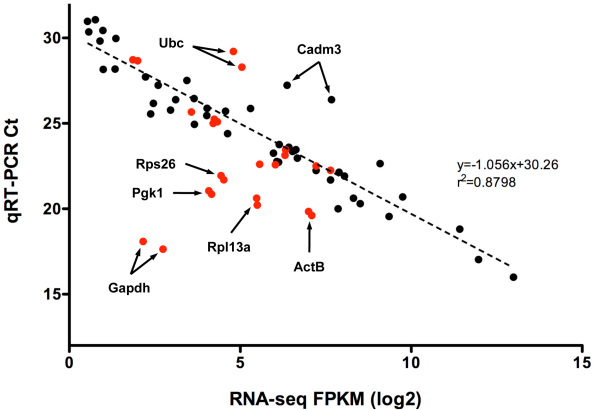
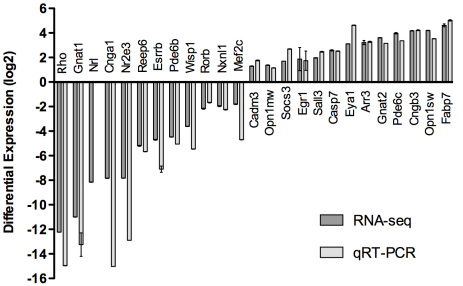
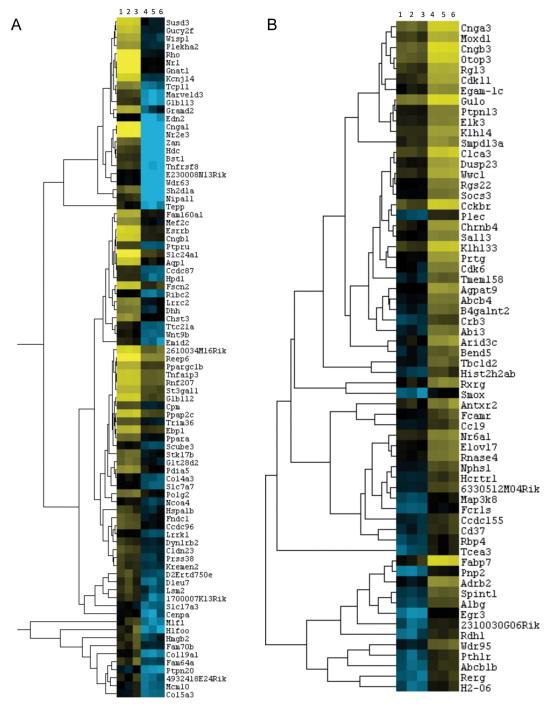
Results: Using an optimized data analysis workflow, we mapped about 30 million sequence reads per sample to the mouse genome (build mm9) and identified 16,014 transcripts in the retinas of WT and Nrl(-/-) mice with BWA workflow and 34,115 transcripts with TopHat workflow. RNA-seq data confirmed stable expression of 25 known housekeeping genes, and 12 of these were validated with qRT-PCR. RNA-seq data had a linear relationship with qRT-PCR for more than four orders of magnitude and a goodness of fit (R(2)) of 0.8798. Approximately 10% of the transcripts showed differential expression between the WT and Nrl(-/-) retina, with a fold change ≥1.5 and p value <0.05. Altered expression of 25 genes was confirmed with qRT-PCR, demonstrating the high degree of sensitivity of the RNA-seq method. Hierarchical clustering of differentially expressed genes uncovered several as yet uncharacterized genes that may contribute to retinal function. Data analysis with BWA and TopHat workflows revealed a significant overlap yet provided complementary insights in transcriptome profiling.

Conclusions: Our study represents the first detailed analysis of retinal transcriptomes, with biologic replicates, generated by RNA-seq technology. The optimized data analysis workflows reported here should provide a framework for comparative investigations of expression profiles. Our results show that NGS offers a comprehensive and more accurate quantitative and qualitative evaluation of mRNA content within a cell or tissue. We conclude that RNA-seq based transcriptome characterization would expedite genetic network analyses and permit the dissection of complex biologic functions.


Figures

Figure 1
Figure 1
Flowchart of RNA-seq data analysis methodology using Burrows-Wheeler Aligner (BWA) and TopHat. Schematic representation of two RNA-seq data analysis workflows and resulting views of the data generated. A: BWA workflow: Gapped alignments are performed using the BWA algorithm against the mouse reference genome build mm9, and estimation of the expression of genes at the transcript isoform level is performed by importing aligned reads into the Partek Genomics Suite using annotations provided by the University of California Santa Cruz (UCSC) refflat.txt file. Transcripts expressed at low levels in all samples (<1 fragments per kilobase of exon model per million mapped reads [FPKM]) are filtered out. Differential expression analysis was performed by applying the ANOVA (ANOVA) method, and the resulting list was sorted and filtered into different transcript groups. Clustering of rod and cone enriched genes was performed using Cluster 3.0 software (see Methods). B: TopHat workflow: Splice junction mapping was performed using the TopHat algorithm in two phases. In the first phase, splice junctions were detected de novo from the reads from each sample and combined to obtain a master splice junctions list. In the second phase of TopHat alignment, reads from each sample were re-aligned by providing the master junctions list as input. The two-phase mapping approach significantly increased the number of alignments spanning the splice junctions. Estimation of gene expression and differential expression were computed using Cufflinks, Cuffcompare, and Cuffdiff. Sorting and filtering of transcript isoforms were performed as in the BWA workflow.
Figure 2
Figure 2
Venn diagrams comparing differentially expressed transcripts (DETs) between the Nrl−/− and WT groups from BWA and TopHat analyses. Despite major differences in the UCSC refFlat annotations used by Burrows-Wheeler Aligner (BWA) and Ensembl annotations used by TopHat, most of the genes identified by BWA were also identified as significant by TopHat. A: Comparison of the total number of DETs identified as significant (fold change ≥1.5 and p-value <0.05) by the two methods. B: Inclusion of the top 500 DETs (424 unique genes) identified as significant by BWA and in the full TopHat DET list. C: Inclusion of the top 200 DETs (179 unique genes) identified as significant by BWA and in the full TopHat DET list. We assess the two methods based on a comparison of qRT–PCR data for the genes detected by either or both methods. The discrepancy between the results can be attributed to differences in the input annotation files used (UCSC refFlat versus Ensembl GTF) by the two methods and their alignment algorithms.
Figure 3
Figure 3
Correlation of RNA-seq and qRT–PCR. The correlations between the RNA-seq fragments per kilobase of exon model per million mapped reads (FPKM) values and the corresponding qRT–PCR crossing threshold (Ct) values are shown. FPKM values represented in log2 scale, and non-normalized Ct values are an average of three biologic replicates. Data generated from differentially expressed genes (black) is contrasted with data generated from the housekeeping genes (red). The dashed line, associated equation, and goodness of fit value were generated by least-squares regression analysis of the differentially expressed data set. Since a lower Ct value indicates an increased initial amount of target mRNA, an inverse relationship between FPKM and Ct values is expected if a correlation exists.
Figure 4
Figure 4
qRT–PCR validation of RNA-seq results. Comparison of differential expression values determined by RNA-seq (dark gray) and qRT–PCR (light gray) for 25 differentially expressed genes identified by Burrows-Wheeler Aligner (BWA) workflow. Error bars represent the standard error of the mean. Neural retina leucine zipper gene (Nrl) was not detectable by qRT–PCR and therefore are left blank in the graph. Note that Rhodopsin (Rho), guanine nucleotide binding protein, alpha transducing 1 (Gnat1), cyclic nucleotide gated channel alpha 1 (Cnga1), and nuclear receptor subfamily 2, group E, member 3 (Nr2e3) having average crossing threshold (Ct) values greater than 30 in the Nrl−/− samples are considered extremely low to non-expressing.
Figure 5
Figure 5
Heatmaps and hierarchical clusters of differentially expressed rod-specific genes and cone-specific genes or those involved in retinal remodeling. Heatmaps with dendrograms of clusters of differentially expressed rod genes (A) and cone / retinal remodeling genes (B) by applying hierarchical clustering. A filtered list of mRNA transcript isoforms was further revised for fold change ≥1.5 and p-value <0.05, and duplicate gene symbol rows were deleted to retain the most expressed isoform as reflective of the gene. This list was used to generate the heatmap and the master cluster. Specific clusters of rod specific genes and cone-specific or retinal remodeling genes were identified as clusters containing known rod genes (e.g., Rhodopsin [Rho], guanine nucleotide binding protein, alpha transducing 1 [Gnat1], cyclic nucleotide gated channel alpha 1 [Cnga1], and nuclear receptor subfamily 2, group E, member 3 [Nr2e3]) and cone genes (e.g., fatty acid binding protein 7, brain [Fabp7], cyclic nucleotide gated channel alpha 3 [Cnga3], cyclic nucleotide gated channel beta 3 [Cngb3]). Columns 1, 2, and 3 are wild-type samples, and columns 4, 5, and 6 are Nrl−/− samples.
Figure 6
Figure 6
Comparison of the current and previous data sets of differentially expressed transcripts of Nrl−/− versus wild type (WT) mouse retina. Overlap between the differentially expressed transcripts (DETs) identified in the current study and previous studies using mouse retinas from the same age and genotype was determined using the Mouse Genome Informatics (MGI) gene symbol as the identifier. The current study includes all mRNA transcripts identified with the Burrows-Wheeler Aligner (BWA) workflow (fold change ≥1.5 and p value <0.05). The 438 DETs of an Affymetrix microarray study [38] and 6,123 DETs from another RNA-seq study [54] with similar criteria were used for comparison with our study. Of the 438 DETs from the Corbo et al. [38] study, 157 transcripts are not significantly differentially expressed in our data, 11 are expressed below the fragments per kilobase of exon model per million mapped reads (FPKM) detection threshold of 1.0, and 38 do not map to the current annotations. Of the 6,123 DETs from the Mustafi et al. [54] study, 4,858 transcripts are not significantly differentially expressed in our study, 348 are expressed below our FPKM detection threshold of 1.0, and 62 do not map to the current annotations.

Similar articles

Cited by

References

    1. Margulies M, Egholm M, Altman WE, Attiya S, Bader JS, Bemben LA, Berka J, Braverman MS, Chen YJ, Chen Z, Dewell SB, Du L, Fierro JM, Gomes XV, Godwin BC, He W, Helgesen S, Ho CH, Irzyk GP, Jando SC, Alenquer ML, Jarvie TP, Jirage KB, Kim JB, Knight JR, Lanza JR, Leamon JH, Lefkowitz SM, Lei M, Li J, Lohman KL, Lu H, Makhijani VB, McDade KE, McKenna MP, Myers EW, Nickerson E, Nobile JR, Plant R, Puc BP, Ronan MT, Roth GT, Sarkis GJ, Simons JF, Simpson JW, Srinivasan M, Tartaro KR, Tomasz A, Vogt KA, Volkmer GA, Wang SH, Wang Y, Weiner MP, Yu P, Begley RF, Rothberg JM. Genome sequencing in microfabricated high-density picolitre reactors. Nature. 2005;437:376–80. - PMC - PubMed
    1. Shendure J, Porreca GJ, Reppas NB, Lin X, McCutcheon JP, Rosenbaum AM, Wang MD, Zhang K, Mitra RD, Church GM. Accurate multiplex polony sequencing of an evolved bacterial genome. Science. 2005;309:1728–32. - PubMed
    1. Schuster SC. Next-generation sequencing transforms today's biology. Nat Methods. 2008;5:16–8. - PubMed
    1. Tsuji S. Genetics of neurodegenerative diseases: insights from high-throughput resequencing. Hum Mol Genet. 2010;19(R1):R65–70. - PMC - PubMed
    1. Roukos DH. Next-generation sequencing and epigenome technologies: potential medical applications. Expert Rev Med Devices. 2010;7:723–6. - PubMed

Publication types

MeSH terms