

Comparative Structures and Evolution of Vertebrate Carboxyl Ester Lipase (CEL) Genes and Proteins with a Major Role in Reverse Cholesterol Transport
- PMID: 22162806
- PMCID: PMC3227413
- DOI: 10.1155/2011/781643
Comparative Structures and Evolution of Vertebrate Carboxyl Ester Lipase (CEL) Genes and Proteins with a Major Role in Reverse Cholesterol Transport
Abstract
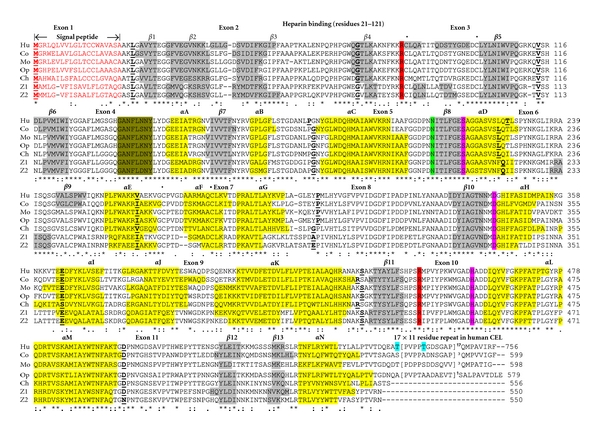
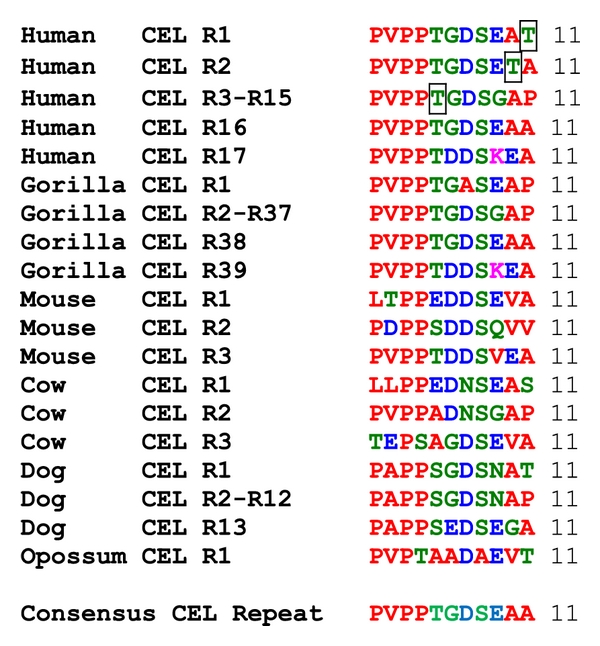
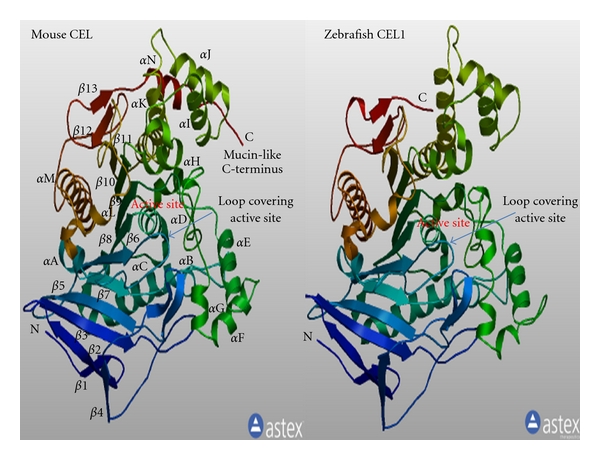
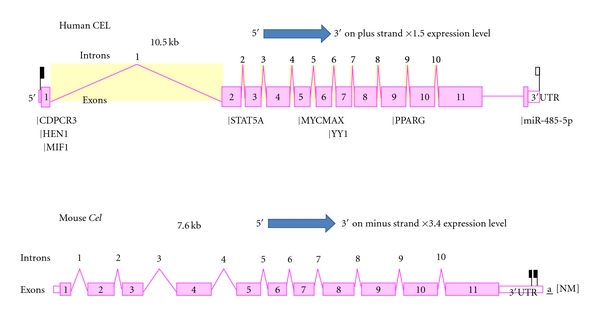
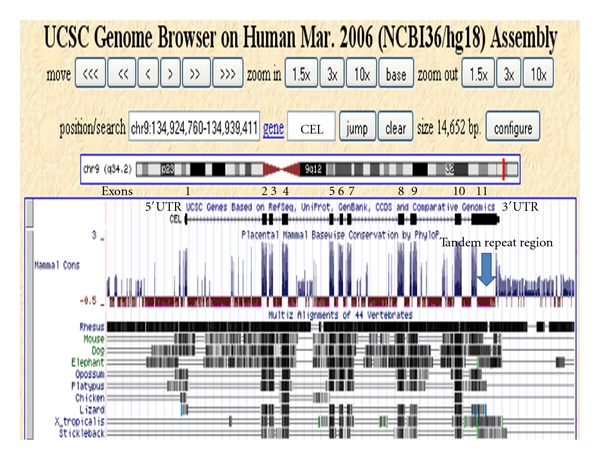
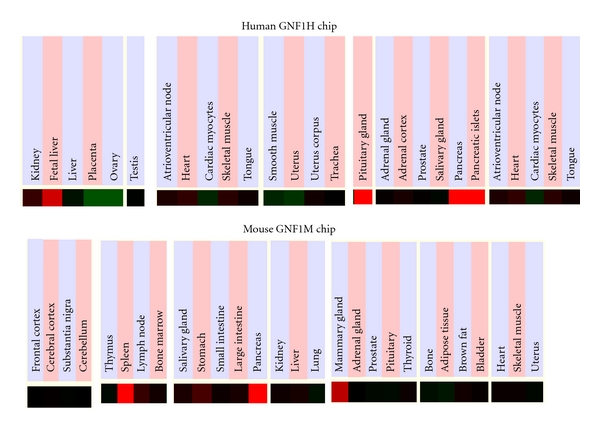
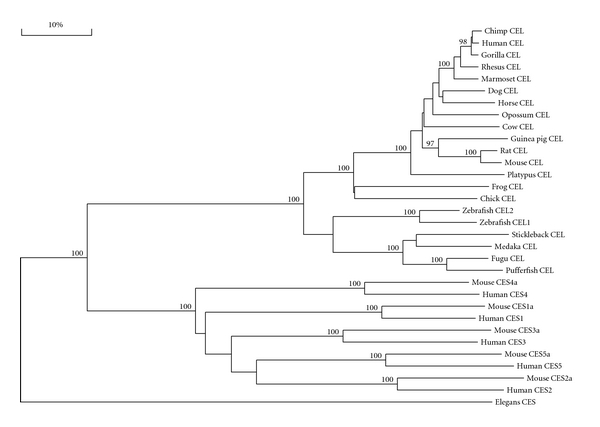
Bile-salt activated carboxylic ester lipase (CEL) is a major triglyceride, cholesterol ester and vitamin ester hydrolytic enzyme contained within pancreatic and lactating mammary gland secretions. Bioinformatic methods were used to predict the amino acid sequences, secondary and tertiary structures and gene locations for CEL genes, and encoded proteins using data from several vertebrate genome projects. A proline-rich and O-glycosylated 11-amino acid C-terminal repeat sequence (VNTR) previously reported for human and other higher primate CEL proteins was also observed for other eutherian mammalian CEL sequences examined. In contrast, opossum CEL contained a single C-terminal copy of this sequence whereas CEL proteins from platypus, chicken, lizard, frog and several fish species lacked the VNTR sequence. Vertebrate CEL genes contained 11 coding exons. Evidence is presented for tandem duplicated CEL genes for the zebrafish genome. Vertebrate CEL protein subunits shared 53-97% sequence identities; demonstrated sequence alignments and identities for key CEL amino acid residues; and conservation of predicted secondary and tertiary structures with those previously reported for human CEL. Phylogenetic analyses demonstrated the relationships and potential evolutionary origins of the vertebrate CEL family of genes which were related to a nematode carboxylesterase (CES) gene and five mammalian CES gene families.
Figures
Similar articles
-
Vertebrate endothelial lipase: comparative studies of an ancient gene and protein in vertebrate evolution.Genetica. 2011 Mar;139(3):291-304. doi: 10.1007/s10709-011-9549-1. Epub 2011 Jan 26. Genetica. 2011. PMID: 21267636 Free PMC article.
-
cDNA cloning of carboxyl ester lipase from human pancreas reveals a unique proline-rich repeat unit.J Lipid Res. 1991 Feb;32(2):267-76. J Lipid Res. 1991. PMID: 2066663
-
Mammalian carboxylesterase 3: comparative genomics and proteomics.Genetica. 2010 Jul;138(7):695-708. doi: 10.1007/s10709-010-9438-z. Epub 2010 Apr 28. Genetica. 2010. PMID: 20422440 Free PMC article.
-
The role of the carboxyl ester lipase (CEL) gene in pancreatic disease.Pancreatology. 2018 Jan;18(1):12-19. doi: 10.1016/j.pan.2017.12.001. Epub 2017 Dec 5. Pancreatology. 2018. PMID: 29233499 Review.
-
Comparative studies of vertebrate iduronate 2-sulfatase (IDS) genes and proteins: evolution of A mammalian X-linked gene.3 Biotech. 2017 May;7(1):22. doi: 10.1007/s13205-016-0595-3. Epub 2017 Apr 11. 3 Biotech. 2017. PMID: 28401457 Free PMC article. Review.
Cited by
-
Low-density lipoprotein, its susceptibility to oxidation and the role of lipoprotein-associated phospholipase A2 and carboxyl ester lipase lipases in atherosclerotic plaque formation.Arch Med Sci. 2013 Feb 21;9(1):151-8. doi: 10.5114/aoms.2013.33176. Epub 2013 Feb 10. Arch Med Sci. 2013. PMID: 23515030 Free PMC article.
-
The mucinous domain of pancreatic carboxyl-ester lipase (CEL) contains core 1/core 2 O-glycans that can be modified by ABO blood group determinants.J Biol Chem. 2018 Dec 14;293(50):19476-19491. doi: 10.1074/jbc.RA118.001934. Epub 2018 Oct 12. J Biol Chem. 2018. PMID: 30315106 Free PMC article.
-
The CEL-HYB1 Hybrid Allele Promotes Digestive Enzyme Misfolding and Pancreatitis in Mice.Cell Mol Gastroenterol Hepatol. 2022;14(1):55-74. doi: 10.1016/j.jcmgh.2022.03.013. Epub 2022 Apr 7. Cell Mol Gastroenterol Hepatol. 2022. PMID: 35398595 Free PMC article.
-
Comparative Study of the Molecular Characterization, Evolution, and Structure Modeling of Digestive Lipase Genes Reveals the Different Evolutionary Selection Between Mammals and Fishes.Front Genet. 2022 Aug 4;13:909091. doi: 10.3389/fgene.2022.909091. eCollection 2022. Front Genet. 2022. PMID: 35991544 Free PMC article.
-
Pancreatic adenocarcinoma, chronic pancreatitis, and MODY-8 diabetes: is bile salt-dependent lipase (or carboxyl ester lipase) at the crossroads of pancreatic pathologies?Oncotarget. 2017 Dec 22;9(15):12513-12533. doi: 10.18632/oncotarget.23619. eCollection 2018 Feb 23. Oncotarget. 2017. PMID: 29552330 Free PMC article. Review.
References
-
- Wang X, Wang CS, Tang J, Dyda F, Zhang XC. The crystal structure of bovine bile salt activated lipase: insights into the bile salt activation mechanism. Structure. 1997;5(9):1209–1218. - PubMed
-
- Nilsson J, Blackberg L, Carlsson P, Enerback S, Hernell O, Bjursell G. cDNA cloning of human-milk bile-salt stimulated lipase and evidence for its identity to pancreatic carboxylic ester hydrolase. European Journal of Biochemistry. 1990;192(2):543–550. - PubMed
Grants and funding
LinkOut - more resources
Full Text Sources
Other Literature Sources
