

Spatiotemporal relations of primary sensorimotor and secondary motor activation patterns mapped by NIR imaging
- PMID: 22162826
- PMCID: PMC3233255
- DOI: 10.1364/BOE.2.003367
Spatiotemporal relations of primary sensorimotor and secondary motor activation patterns mapped by NIR imaging
Abstract
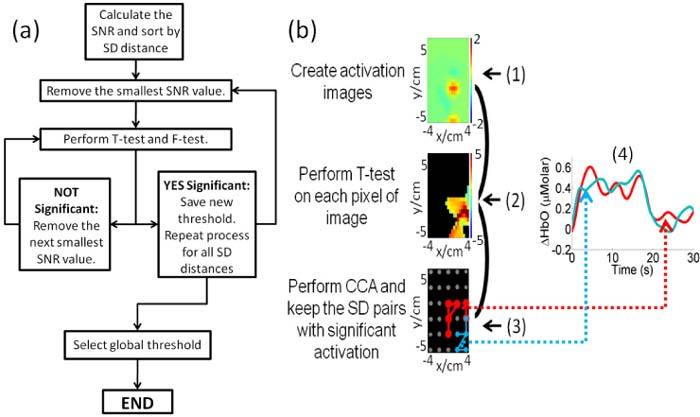
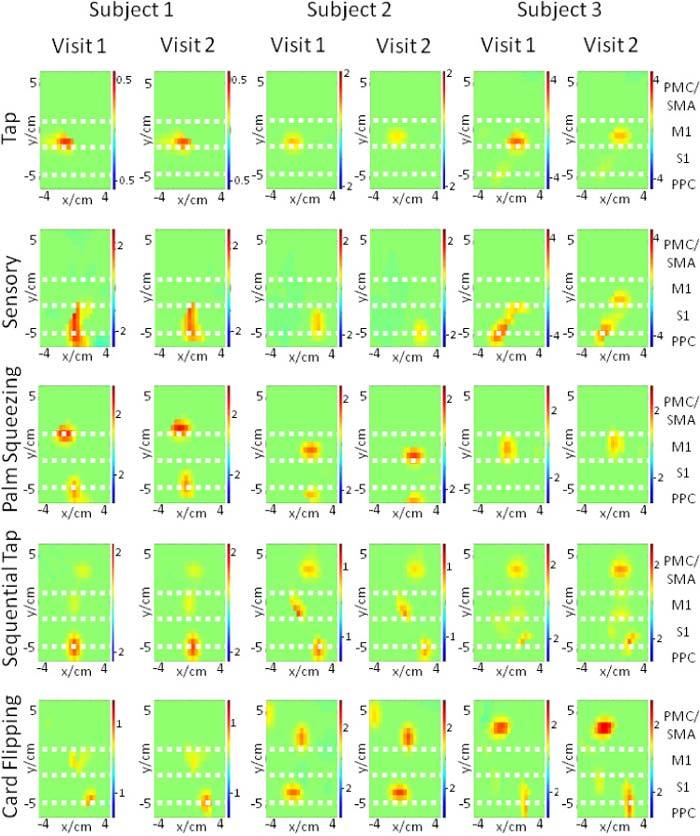
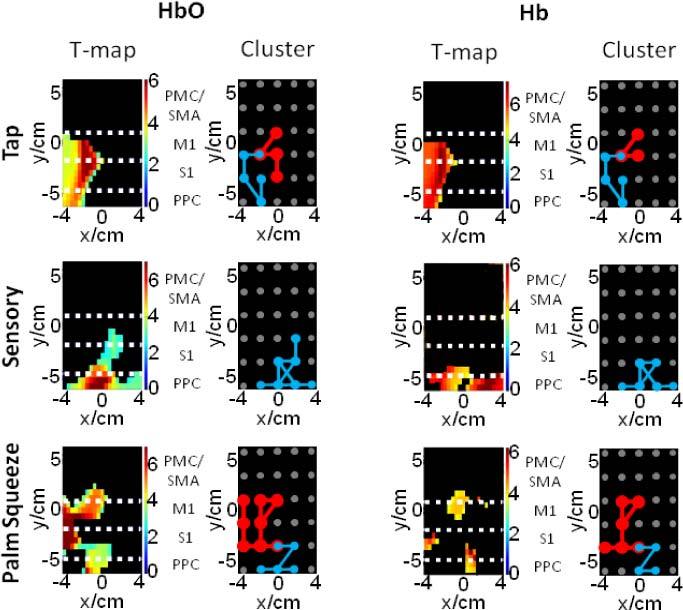
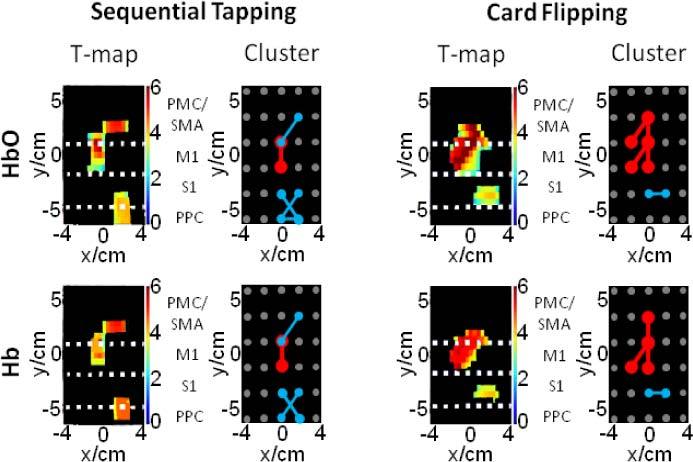
Functional near infrared (fNIR) imaging was used to identify spatiotemporal relations between spatially distinct cortical regions activated during various hand and arm motion protocols. Imaging was performed over a field of view (FOV, 12 x 8.4 cm) including the secondary motor, primary sensorimotor, and the posterior parietal cortices over a single brain hemisphere. This is a more extended FOV than typically used in current fNIR studies. Three subjects performed four motor tasks that induced activation over this extended FOV. The tasks included card flipping (pronation and supination) that, to our knowledge, has not been performed in previous functional magnetic resonance imaging (fMRI) or fNIR studies. An earlier rise and a longer duration of the hemodynamic activation response were found in tasks requiring increased physical or mental effort. Additionally, analysis of activation images by cluster component analysis (CCA) demonstrated that cortical regions can be grouped into clusters, which can be adjacent or distant from each other, that have similar temporal activation patterns depending on whether the performed motor task is guided by visual or tactile feedback. These analyses highlight the future potential of fNIR imaging to tackle clinically relevant questions regarding the spatiotemporal relations between different sensorimotor cortex regions, e.g. ones involved in the rehabilitation response to motor impairments.
Keywords: (100.2960) Image analysis; (170.2655) Functional monitoring and imaging; (170.3880) Medical and biological imaging; (300.6340) Spectroscopy, infrared.
Figures


Similar articles
-
Intracerebral ERD/ERS in voluntary movement and in cognitive visuomotor task.Prog Brain Res. 2006;159:311-30. doi: 10.1016/S0079-6123(06)59021-1. Prog Brain Res. 2006. PMID: 17071240
-
Functional magnetic resonance imaging of visual object construction and shape discrimination : relations among task, hemispheric lateralization, and gender.J Cogn Neurosci. 2001 Jan 1;13(1):72-89. doi: 10.1162/089892901564180. J Cogn Neurosci. 2001. PMID: 11224910
-
Effective Connectivity of Cortical Sensorimotor Networks During Finger Movement Tasks: A Simultaneous fNIRS, fMRI, EEG Study.Brain Topogr. 2016 Sep;29(5):645-60. doi: 10.1007/s10548-016-0507-1. Epub 2016 Jul 20. Brain Topogr. 2016. PMID: 27438589
-
Integrated technology for evaluation of brain function and neural plasticity.Phys Med Rehabil Clin N Am. 2004 Feb;15(1):263-306. doi: 10.1016/s1047-9651(03)00124-4. Phys Med Rehabil Clin N Am. 2004. PMID: 15029909 Review.
-
Comparison of blood-oxygen-level-dependent functional magnetic resonance imaging and near-infrared spectroscopy recording during functional brain activation in patients with stroke and brain tumors.J Biomed Opt. 2007 Nov-Dec;12(6):062110. doi: 10.1117/1.2823036. J Biomed Opt. 2007. PMID: 18163813 Review.
Cited by
-
Functional near-infrared spectroscopy maps cortical plasticity underlying altered motor performance induced by transcranial direct current stimulation.J Biomed Opt. 2013 Nov;18(11):116003. doi: 10.1117/1.JBO.18.11.116003. J Biomed Opt. 2013. PMID: 24193947 Free PMC article.
-
Improving optical contact for functional near‑infrared brain spectroscopy and imaging with brush optodes.Biomed Opt Express. 2012 May 1;3(5):878-98. doi: 10.1364/BOE.3.000878. Epub 2012 Apr 6. Biomed Opt Express. 2012. PMID: 22567582 Free PMC article.
-
Relationship between sensorimotor cortical activation as assessed by functional near infrared spectroscopy and lower extremity motor coordination in bilateral cerebral palsy.Neuroimage Clin. 2018 Jul 30;20:275-285. doi: 10.1016/j.nicl.2018.07.023. eCollection 2018. Neuroimage Clin. 2018. PMID: 30101059 Free PMC article.
-
Sparsity enhanced spatial resolution and depth localization in diffuse optical tomography.Biomed Opt Express. 2012 May 1;3(5):943-57. doi: 10.1364/BOE.3.000943. Epub 2012 Apr 12. Biomed Opt Express. 2012. PMID: 22567587 Free PMC article.
-
Neurovascular coupling: in vivo optical techniques for functional brain imaging.Biomed Eng Online. 2013 Apr 30;12:38. doi: 10.1186/1475-925X-12-38. Biomed Eng Online. 2013. PMID: 23631798 Free PMC article. Review.
References
-
- Burns D. H., Rosendahl S., Bandilla D., Maes O. C., Chertkow H. M., Schipper H. M., “Near-infrared spectroscopy of blood plasma for diagnosis of sporadic Alzheimer’s disease,” J. Alzheimers Dis. 17(2), 391–397 (2009). - PubMed
-
- Khan B., Tian F., Behbehani K., Romero M. I., Delgado M. R., Clegg N. J., Smith L., Reid D., Liu H., Alexandrakis G., “Identification of abnormal motor cortex activation patterns in children with cerebral palsy by functional near-infrared spectroscopy,” J. Biomed. Opt. 15(3), 036008 (2010).10.1117/1.3432746 - DOI - PMC - PubMed
Grants and funding
LinkOut - more resources
Full Text Sources
Other Literature Sources
Miscellaneous