Clinical Trial
. 2011 Dec 19;208(13):2747-59.
doi: 10.1084/jem.20111680. Epub 2011 Dec 12.

Evolutionary genetic dissection of human interferons

Affiliations
Clinical Trial

Evolutionary genetic dissection of human interferons

Jérémy Manry et al. J Exp Med. .

Abstract

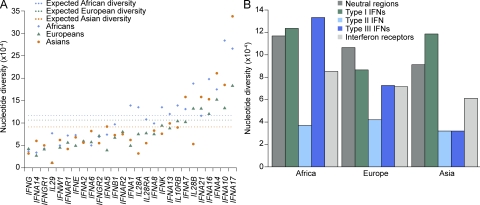
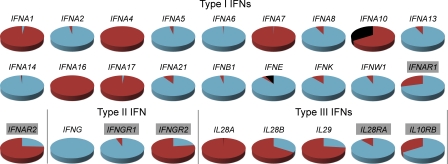
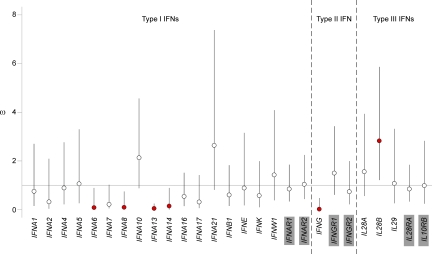
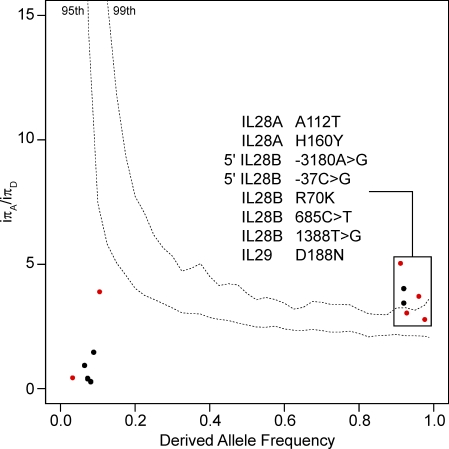
Interferons (IFNs) are cytokines that play a key role in innate and adaptive immune responses. Despite the large number of immunological studies of these molecules, the relative contributions of the numerous IFNs to human survival remain largely unknown. Here, we evaluated the extent to which natural selection has targeted the human IFNs and their receptors, to provide insight into the mechanisms that govern host defense in the natural setting. We found that some IFN-α subtypes, such as IFN-α6, IFN-α8, IFN-α13, and IFN-α14, as well as the type II IFN-γ, have evolved under strong purifying selection, attesting to their essential and nonredundant function in immunity to infection. Conversely, selective constraints have been relaxed for other type I IFNs, particularly for IFN-α10 and IFN-ε, which have accumulated missense or nonsense mutations at high frequencies within the population, suggesting redundancy in host defense. Finally, type III IFNs display geographically restricted signatures of positive selection in European and Asian populations, indicating that genetic variation at these genes has conferred a selective advantage to the host, most likely by increasing resistance to viral infection. Our population genetic analyses show that IFNs differ widely in their biological relevance, and highlight evolutionarily important determinants of host immune responsiveness.


Figures

Figure 1.
Figure 1.
Patterns of nucleotide diversity for the three families of IFN genes and for the genes encoding their receptors in human populations. (A) Nucleotide diversity levels for the individual genes in populations representing major ethnic groups. The expected diversity (dotted lines) corresponds to the mean diversity levels observed for 20 autosomal noncoding regions in each geographic area (Laval et al., 2010). (B) Comparison of nucleotide diversity between IFN families and receptors.
Figure 2.
Figure 2.
Proportion of chromosomes carrying at least one nonsynonymous or nonsense variant in the general human population. The red portion of the pie charts corresponds to the proportion of chromosomes carrying at least one nonsynonymous polymorphism, the black portion to the proportion of chromosomes carrying at least one nonsense polymorphism, and the blue portion to the proportion of chromosomes carrying neither nonsynonymous nor nonsense polymorphisms. Genes shaded in gray correspond to those encoding the receptor subunits of each IFN family.
Figure 3.
Figure 3.
Estimation of the intensity of natural selection acting on the various IFN families and their receptors. The strength of natural selection was assessed by estimating ω values. Under neutrality, ω is not significantly different from 1. Values below 1 are consistent with selection against nonsynonymous variants, whereas values greater than 1 indicate an excess of amino acid changes. Bars indicate 95% Bayesian confidence intervals, and red circles indicate genes with ω estimates significantly above or below 1. Genes shaded in gray correspond to those encoding the receptor subunits of each IFN family.
Figure 4.
Figure 4.
Detection of positive selection in Asia using the DIND test. We plotted iπA/iπD values against derived allele frequencies (DAFs). P-values were obtained by comparing the iπA/iπD values for the three type III IFN genes against the expected iπA/iπD values obtained in 104 simulations, taking into account the most conservative demographic model (Laval et al., 2010). The top dashed line on the graph corresponds to the 99th percentile, and the bottom to the 95th percentile. Dots above the 95th percentile dashed line correspond to mutations that have increased in frequency faster than expected under neutrality in the Asian population. These mutations have been most likely targeted by positive selection, and thus conferred an advantage to the host. Red and black dots correspond to nonsynonymous and silent polymorphisms, respectively. For DIND analyses concerning all genes encoding the 27 IFNs and their receptors in all populations, see Fig. S3.
Figure 5.
Figure 5.
Detection of positive selection on the basis of levels of population differentiation. Population pairwise FST values are plotted against expected heterozygosity for all the SNPs identified in our study for Africans versus Europeans (A), Africans versus Asians (B), and Europeans versus Asians (C). The dashed lines represent the 99th and 95th percentiles of the HGDP-CEPH genotyping dataset for the same individuals (represented by the density area in blue; Li et al., 2008). Black dots correspond to silent polymorphisms and red dots correspond to nonsynonymous polymorphisms.
Figure 6.
Figure 6.
Spatial distribution of positively selected variants across type III IFN genes. Genomic organization of the three members of the type III IFN family, IL28B, IL28A, and IL29. Filled boxes correspond to exonic regions, and arrows above exons indicate the direction of the open reading frame. Genetic variants displaying signatures of population-specific positive selection are shown; noncoding SNPs are indicated in black and amino acid changes in red. At the gene level, IL28A and IL28B displayed signatures of positive selection in Asia, and IL29 in both Europe and Asia (Table 2). At the SNP level, the action of positive selection targeting the five SNPs at IL28B and the two at IL28A was supported by the DIND test (Fig. 4), whereas that at the IL29 D188N variant was supported by the DIND test and iHS, as well as by the levels of population differentiation (Fig. 5).

Similar articles

Cited by

References

    1. Adzhubei I.A., Schmidt S., Peshkin L., Ramensky V.E., Gerasimova A., Bork P., Kondrashov A.S., Sunyaev S.R. 2010. A method and server for predicting damaging missense mutations. Nat. Methods. 7:248–249 10.1038/nmeth0410-248 - DOI - PMC - PubMed
    1. Altshuler D.M., Gibbs R.A., Peltonen L., Altshuler D.M., Gibbs R.A., Peltonen L., Dermitzakis E., Schaffner S.F., Yu F., Peltonen L., et al. ; International HapMap 3 Consortium 2010. Integrating common and rare genetic variation in diverse human populations. Nature. 467:52–58 10.1038/nature09298 - DOI - PMC - PubMed
    1. Banchereau J., Pascual V. 2006. Type I interferon in systemic lupus erythematosus and other autoimmune diseases. Immunity. 25:383–392 10.1016/j.immuni.2006.08.010 - DOI - PubMed
    1. Banchereau J., Pascual V., Palucka A.K. 2004. Autoimmunity through cytokine-induced dendritic cell activation. Immunity. 20:539–550 10.1016/S1074-7613(04)00108-6 - DOI - PubMed
    1. Barreiro L.B., Quintana-Murci L. 2010. From evolutionary genetics to human immunology: how selection shapes host defence genes. Nat. Rev. Genet. 11:17–30 10.1038/nrg2698 - DOI - PubMed

Publication types