Clinical Trial
. 2011 Dec 19;208(13):2571-9.
doi: 10.1084/jem.20112239. Epub 2011 Dec 12.

ETV6 mutations in early immature human T cell leukemias

Affiliations
Clinical Trial

ETV6 mutations in early immature human T cell leukemias

Pieter Van Vlierberghe et al. J Exp Med. .

Abstract

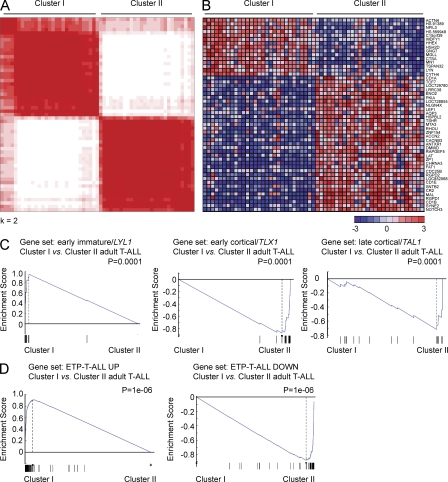
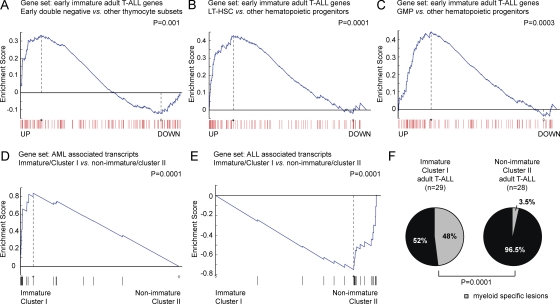
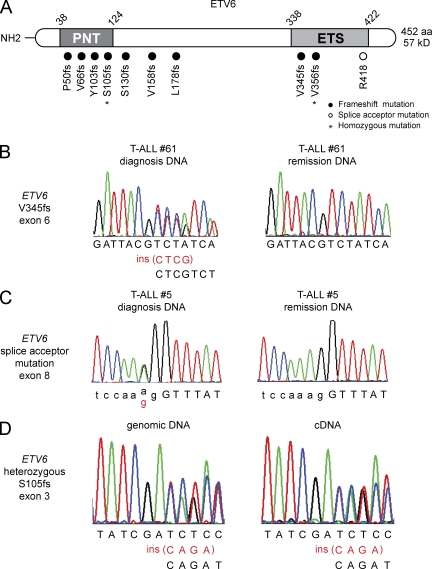
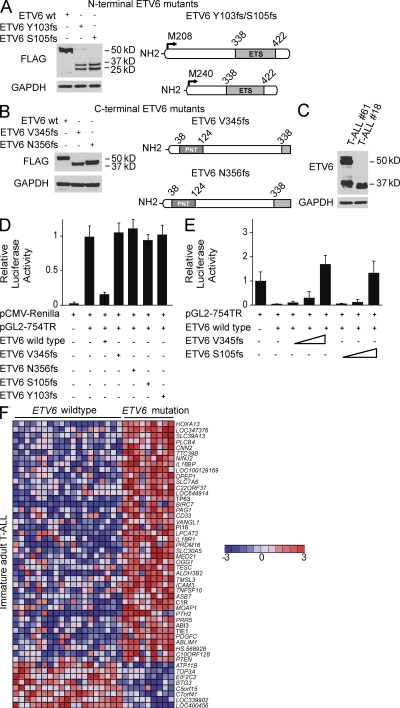
Early immature T cell acute lymphoblastic leukemias (T-ALLs) account for ~5-10% of pediatric T-ALLs and are associated with poor prognosis. However, the genetic defects that drive the biology of these tumors remain largely unknown. In this study, analysis of microarray gene expression signatures in adult T-ALL demonstrated a high prevalence of early immature leukemias and revealed a close relationship between these tumors and myeloid leukemias. Many adult immature T-ALLs harbored mutations in myeloid-specific oncogenes and tumor suppressors including IDH1, IDH2, DNMT3A, FLT3, and NRAS. Moreover, we identified ETV6 mutations as a novel genetic lesion uniquely present in immature adult T-ALL. Our results demonstrate that early immature adult T-ALL represents a heterogeneous category of leukemias characterized by the presence of overlapping myeloid and T-ALL characteristics, and highlight the potential role of ETV6 mutations in these tumors.


Figures

Figure 1.
Figure 1.
Gene expression profiling identifies high prevalence of early immature leukemias in adult T-ALL. (A) Consensus clustering of microarray gene expression data of 57 adult T-ALL samples. (B) Top 50 differentially expressed genes between adult T-ALL cluster I and cluster II samples. Genes in the heat map are shown in rows and each individual sample is shown in one column. The scale bar shows color-coded differential expression from the mean in standard deviation units with red indicating higher levels and blue lower levels of expression. (C) GSEA analysis of early immature/LYL1-positive, early cortical/TLX1-positive, and late cortical/TAL1-positive associated genes in the gene expression clusters I and II identified in adult T-ALL. (D) GSEA of genes associated with pediatric ETP-T-ALLs in adult T-ALL gene expression clusters.
Figure 2.
Figure 2.
Myeloid and stem cell features of immature adult T-ALL. (A–C) GSEA of transcripts significantly up-regulated in early immature adult T-ALL in gene expression signatures obtained from human early double negative thymocytes (CD34+CD1aCD4CD8; A) against all other thymocyte groups, long term hematopoietic stem cells (LT-HSC; B), and granulocyte-monocyte progenitors (GMP; C) against all other hematopoietic populations. (D and E) GSEA of AML- (D) or ALL-associated (E) transcripts in early immature (cluster I) versus other (cluster II) adult T-ALLs. (F) Differential distribution of myeloid-specific lesions in immature (cluster I) versus other (cluster II) adult T-ALLs.
Figure 3.
Figure 3.
ETV6 mutations in early immature adult T-ALL. (A) Schematic representation of the structure of the ETV6 protein. The N-terminal pointed (PNT) homodimerization domain and the C-terminal DNA-binding domain (ETS-domain) are indicated. ETV6 mutations identified in primary adult T-ALL samples are shown. Filled circles represent frameshift mutations, whereas the splice acceptor mutation in the exon 8 splice acceptor sequence is depicted as an open circle. (B and C) Representative DNA sequencing chromatograms of paired diagnosis and remission genomic T-ALL DNA samples showing a somatic frameshift mutation in exon 6 (B) and a splice acceptor mutation in exon 8 of ETV6 (C). (D) Sequence analysis of paired ETV6 genomic DNA and cDNA shows biallelic expression of wild-type and mutant ETV6 transcripts.
Figure 4.
Figure 4.
Functional analysis of truncating ETV6 mutant alleles. (A and B) Western blot analysis of FLAG-tagged N-terminal (Y103fs, S105fs) (A) and C-terminal (V345fs, N356fs) (B) ETV6 mutants expressed in HEK293T cells. The FLAG epitope was introduced in the C terminus of the N-terminal Y103fs and S105fs mutants and in the N terminus of the C-terminal ETV6 V345fs and N356fs mutants. Blots were probed with anti-FLAG or anti-GAPDH as loading control. (C) Lysates from primary adult T-ALL samples harboring a heterozygous C-terminal (V345fs, #61) and a homozygous N-terminal (Y103fs,#18) ETV6 mutation were analyzed by Western blot. Wild-type ETV6 proteins are detected as 50 and 57 kD anti-ETV6 immunoreactive bands and anti-GAPDH as loading control. (D) Effects of ETV6 mutant alleles in the activity an ETV6-responsive reporter plasmid (pGL2-754TR). Luciferase activity is shown relative to empty vector and normalized using an internal control plasmid expressing Renilla luciferase. Experiments were performed in triplicate and repeated at least twice. (E) Luciferase assay analyzing the effects of increasing amounts (indicated by wedges) of C-terminal (V345fs) and N-terminal (S105fs) ETV6 mutants on the activity of wild-type ETV6. Experiments were performed in triplicate and repeated at least twice. (F) Supervised analysis of ETV6 mutant versus ETV6 wild-type gene expression signatures in early immature adult T-ALLs (P < 0.001). Top 50 differentially expressed genes are shown. Genes in the heat map are shown in rows, each individual sample is shown in one column. The scale bar shows color-coded differential expression from the mean in standard deviation units, with red indicating higher levels and blue lower levels of expression.
Figure 5.
Figure 5.
Transcriptional program regulated by ETV6 in T-ALL. (A) RT-PCR (top) and Western blot (bottom) analysis of ETV6 expression in LOUCY cells expressing control siRNA or one of two ETV6-specific siRNAs. (B) GSEA of the early immature ETV6 mutant T-ALL–associated transcripts in control siRNA versus ETV6 knockdown LOUCY cells. Heatmap of genes up-regulated in early immature ETV6 mutant T-ALL most differentially expressed in control siRNA versus ETV6 knockdown LOUCY cells. The myeloid marker CD33 and genes involved in leukemia development and stem cell homeostasis are shown in red. Genes in the heat map are shown in rows and each individual sample is shown in one column. The scale bar shows color-coded differential expression from the mean in standard deviation units, with red indicating higher levels and blue lower levels of expression.

References

    1. Andersson A.K., Miller D.W., Lynch J.A., Lemoff A.S., Cai Z., Pounds S.B., Radtke I., Yan B., Schuetz J.D., Rubnitz J.E., et al. 2011. IDH1 and IDH2 mutations in pediatric acute leukemia. Leukemia. 25:1570–1577 10.1038/leu.2011.133 - DOI - PMC - PubMed
    1. Bach C., Buhl S., Mueller D., García-Cuéllar M.P., Maethner E., Slany R.K. 2010. Leukemogenic transformation by HOXA cluster genes. Blood. 115:2910–2918 10.1182/blood-2009-04-216606 - DOI - PubMed
    1. Barjesteh van Waalwijk van Doorn-Khosrovani S., Spensberger D., de Knegt Y., Tang M., Löwenberg B., Delwel R. 2005. Somatic heterozygous mutations in ETV6 (TEL) and frequent absence of ETV6 protein in acute myeloid leukemia. Oncogene. 24:4129–4137 - PubMed
    1. Bernassola F., Oberst A., Melino G., Pandolfi P.P. 2005. The promyelocytic leukaemia protein tumour suppressor functions as a transcriptional regulator of p63. Oncogene. 24:6982–6986 10.1038/sj.onc.1208843 - DOI - PubMed
    1. Bhandoola A., Sambandam A. 2006. From stem cell to T cell: one route or many? Nat. Rev. Immunol. 6:117–126 10.1038/nri1778 - DOI - PubMed

Publication types

MeSH terms

Substances

Associated data