. 2011 Dec 19;208(13):2657-73.
doi: 10.1084/jem.20111102. Epub 2011 Dec 12.

Guanylate binding protein 1 is a novel effector of EGFR-driven invasion in glioblastoma

Affiliations

Guanylate binding protein 1 is a novel effector of EGFR-driven invasion in glioblastoma

Ming Li et al. J Exp Med. .

Abstract

Although GBP1 (guanylate binding protein 1) was among the first interferon-inducible proteins identified, its function is still largely unknown. Epidermal growth factor receptor (EGFR) activation by amplification or mutation is one of the most frequent genetic lesions in a variety of human tumors. These include glioblastoma multiforme (GBM), which is characterized by independent but interrelated features of extensive invasion into normal brain parenchyma, rapid growth, necrosis, and angiogenesis. In this study, we show that EGFR activation promoted GBP1 expression in GBM cell lines through a signaling pathway involving Src and p38 mitogen-activated protein kinase. Moreover, we identified YY1 (Yin Yang 1) as the downstream transcriptional regulator regulating EGFR-driven GBP1 expression. GBP1 was required for EGFR-mediated MMP1 (matrix metalloproteinase 1) expression and glioma cell invasion in vitro. Although deregulation of GBP1 expression did not affect glioma cell proliferation, overexpression of GBP1 enhanced glioma cell invasion through MMP1 induction, which required its C-terminal helical domain and was independent of its GTPase activity. Reducing GBP1 levels by RNA interference in invasive GBM cells also markedly inhibited their ability to infiltrate the brain parenchyma of mice. GBP1 expression was high and positively correlated with EGFR expression in human GBM tumors and cell lines, particularly those of the neural subtype. Together, these findings establish GBP1 as a previously unknown link between EGFR activity and MMP1 expression and nominate it as a novel potential therapeutic target for inhibiting GBM invasion.


Figures

Figure 1.
Figure 1.
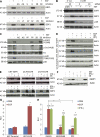
EGFR activity promotes GBP1 expression in GBM cells. (A and B) U87-EGFR cells were serum starved for 24 h and then stimulated with the indicated amount of EGF for 6 h (top) or with 20 ng/ml EGF treatment for the indicated time period (bottom). The expression of GBP1 was analyzed by semiquantitative RT-PCR (A) and Western blot (B). (C) After 24 h of serum starvation, U87-EGFR cells were pretreated with AD or CHX for 1 h followed by 20 ng/ml EGF treatment for 6 h. GBP1 mRNA was measured by RT-PCR. (D) Western blot analysis of GBP1 induction by EGF in three other GBM cell lines. Cells were serum starved and treated with 20 ng/ml EGF for 24 h. Data are representative of at least two independent experiments.
Figure 2.
Figure 2.
GBP1 is co-overexpressed with EGFR in GBM. (A) GBP1 and EGFR expression in GBM patients was measured by qPCR analysis. Normal denotes normal brain tissue. (right) Pearson r test. (B) Analysis of GBP1 gene expression in glioblastoma using the Oncomine database. (C) TCGA analysis of GBP1 and EGFR correlation in 301 GBM patient samples. The correlation is also shown in the four indicated subtypes of GBM (Verhaak et al., 2010). Classical, n = 82; mesenchymal, n = 88; neural, n = 55; proneural, n = 76. Data are representative of at least two independent experiments. Error bars represent SD.
Figure 3.
Figure 3.
EGFR signaling–stimulated GBP1 expression is Src and p38 MAPK dependent, whereas IFN-γ–induced GBP1 expression is not. (A) After 24 h of serum starvation, U87-EGFR cells were treated with DMSO (−), 10 µM of the EGFR tyrosine kinase inhibitor AG1478 (AG), 20 µM of the MEK inhibitors U0126 (U) or PD980589 (PD), 20 µM of the p38 inhibitor SB203580 (SB), 10 µM of the PI3K inhibitor LY294002 (LY), or 20 µM of the JNK inhibitor SP600125 (SP) for 1 h followed by 20 ng/ml EGF treatment for 24 h before Western blot analysis. (B) U87-EGFR cells were transfected with the indicated concentration of p38 siRNA (si-p38) or control siRNA (si-Luc) for 24 h and then serum starved for 24 h before 20 ng/ml EGF treatment for an additional 24 h followed by Western blot analysis. (C) U87-EGFR cells were pretreated with DMSO (−), AG1478, SB203580, or PP2 (PP) for 1 h and then treated with 100 ng/ml EGF for 30 min before Western blot analysis. Total Src and p38 were used as loading controls. (D) U87-EGFR, U373-EGFR, and U178-EGFR cells were treated with DMSO (−), PP2, or SB203580 for 1 h before 20 ng/ml EGF treatment for 24 h. Cells were analyzed by Western blot. (E) U87-EGFR, U373-EGFR, and U178-EGFR cells were treated with DMSO (−), PP2, or SB203580 for 1 h before 20 ng/ml IFN-γ treatment for 24 h before Western blot analysis. (F) GBM26 cells were treated with DMSO (−) or SB203580 for 1 h before 20 ng/ml EGF or 20 ng/ml IFN-γ treatment for 24 h before Western blot analysis. All data are representative of at least two independent experiments. (G) U87 parental or U87-EGFR cells were transfected with pGL3-237 and pRL-TK for 24 h and then serum starved for 24 h followed by PBS or 20 ng/ml EGF treatment for an additional 6 h. Firefly and Renilla luciferase activities were measured, and promoter activity is presented as the fold induction of RLU (values of firefly luciferase unit/values of Renilla) as compared with the control. This result is expressed as the mean of three independent experiments ± SD. *, P < 0.01. (H) U87-EGFR cells were transfected with pGL3-237 and pRL-TK for 24 h and then serum starved for 24 h. The starved cells were pretreated with DMSO, 10 µM PP2, or 20 µM SB203580 for 1 h and then exposed to PBS, 20 ng/ml EGF, or 20 ng/ml IFN-γ for 6 h before reporter assay. This result is expressed as the mean of three independent experiments ± SD. *, P < 0.01.
Figure 4.
Figure 4.
Stat1 is not required for EGFR-mediated GBP1 expression. (A) U87-EGFR cells were pretreated with 20 µM SB203580 for 1 h and then exposed to 100 ng/ml EGF or 100 ng/ml IFN-γ for 30 min before Western blot analysis. Total p38 is shown as a loading control. (B and C) U87-EGFR cells were transfected with Stat1 siRNA (si-stat1) or the control siRNA (si-Luc) before 20 ng/ml EGF (B) or 20 ng/ml IFN-γ treatment (C) for 24 h, and GBP1 expression was analyzed by Western blot. Data are representative of two independent experiments. (D) Stat1-null U3a cells are derived from parental 2fTGH cells. U3a-S1 cells are U3a cells reconstituted for Stat1. The cells were treated with 0, 5, 10, 20, 50, or 100 ng/ml IFN-γ for 24 h before Western blot analysis. (E) U3a and U3a-s1 cells transduced with EGFR were treated with 20 ng/ml EGF for 24 h before Western blot analysis. Data are representative of two independent experiments.
Figure 5.
Figure 5.
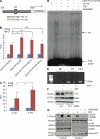
YY1 is involved in regulation of EGFR-mediated GBP1 expression. (A) Schematic representation of cis intact (WT) and mutant (mt) YY1 binding motif in the GBP1 proximal promoter. (B) U87-EGFR cells were transfected with the GBP1 wild-type promoter pGL3-237 and the internal control pRL-TK with or without 200-fold excess of YY1 wild-type or mutant decoy or the YY1 deactivated GBP1 promoter pGL3-237-yy1mt and pRL-TK for 24 h and then serum starved for 24 h before 20 ng/ml EGF treatment for 6 h. Firefly and Renilla luciferase activities were measured, and promoter activity was presented as the fold induction of RLU (values of firefly luciferase unit/values of Renilla luciferase unit) as compared with the control. This result is expressed as the mean of three independent experiments ± SD. #, P < 0.05; *, P < 0.01. (C) U87-EGFR cells were transfected with YY1 or Luc-specific siRNA for 24 h and then transfected with pGL3-237/pRL-TK for 24 h. The cells were serum starved for an additional 24 h before 20 ng/ml EGF or PBS treatment for 6 h. Promoter activity was presented as the fold induction of RLU as compared with the control. The result is presented as mean ± SD of three independent experiments. #, P < 0.05; *, P < 0.01. (D) EMSA analysis. Double-strand YY1 DNA probe was labeled with γ-[32P]ATP and bound to the nuclear extracts of EGF- and/or SB203580-treated U87-EGFR cells with or without preincubation with a 100-fold excess of YY1 probe or YY1-specific antibody. (E) ChIP analysis of YY1 element from untreated and EGF-treated (100 ng/ml, 30 min) U87-EGFR cells using an antibody specific for YY1 or rabbit IgG control. Input chromatin is presented. PCR was performed to amplify the proximal GBP1 promoter (237 bp). This experiment was repeated twice, yielding identical results. (F) U87-EGFR cells were transfected with YY1 or control siRNA for 24 h and then serum starved for 24 h before 20 ng/ml EGF stimulation for 24 h. GBP1 and YY1 expression were analyzed by Western blot. Data are representative of at least two independent experiments. (G) After 24 h of serum starvation, U87-EGFR cells were treated with DMSO vehicle or 20 µM of p38 inhibitor SB203580 for 1 h followed by 100 ng/ml EGF treatment for 30 min before cell fractionation and Western blot analysis. Data are representative of two independent experiments.
Figure 6.
Figure 6.
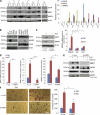
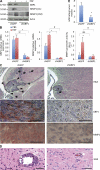
GBP1 is required for EGFR-mediated MMP1 expression and invasion. (A) Expression profiles of EGFR, GBP1, and MMP1 in GBM patient samples were analyzed by Western blot (left). The band density was analyzed by ImageJ software (National Institutes of Health; right). T and N denote tumor and normal brain, respectively. Asterisks denote coexpression of the three proteins in the indicated samples. (B) Western blot analysis of expression of EGFR, GBP1, and MMP1 in GBM cell line cultures. (C, left) U178-EGFR cells were transfected with GBP1 siRNA (si-GBP1) or control siRNA (si-Luc) for 24 h and then serum starved for 24 h before EGF stimulation for an additional 24 h. The expression of GBP1 and MMP1 was analyzed by Western blot. (right) RT-qPCR analysis of MMP1 expression. Serum-starved U178-EGFR cells were pretreated with AD or CHX for 1 h followed by 20 ng/ml EGF treatment for 6 h. *, P < 0.01. (D) RT-qPCR analysis of GBP1 (left) and MMP1 (middle) mRNA expression was performed in U87-EGFR cells transfected with si-Luc or si-GBP1 in the presence or absence of 20 ng/ml EGF for 6 h. Human MMP1 promoter activity was determined by cotransfecting pGL3-MMP1 (2,942 bp) and pRL-TK (internal control) with siRNA targeting GBP1 (si-GBP1) or luciferase control (si-Luc) into U87-EGFR cells with or without 20 ng/ml EGF treatment for 6 h. (right) Firefly and Renilla luciferase activities were measured, and promoter activity is presented as the fold induction of RLU as compared with the control. This result is expressed as the mean of three independent experiments ± SD. *, P < 0.01; **, P < 0.001. (E) U178-EGFR/si-Luc and U178-EGFR/si-GBP1 cells were treated with or without 20 ng/ml EGF for 24 h followed by 10 µM MG132 treatment for 6 h before Western blot analysis. (F) U178-EGFR/si-Luc and U178-EGFR/si-GBP1 cells were treated with or without 20 ng/ml EGF for 24 h followed by analysis of cell invasion using BioCoat Matrigel invasion chambers. *, P < 0.05. Data are representative of three independent experiments. Error bars represent SD. Bar, 100 µm.
Figure 7.
Figure 7.
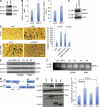
The helical domain of GBP1 is essential for MMP1 induction and GBM cell invasion. (A) The expression of the protein was analyzed by Western blot in A1207-LacZ and A1207-GBP1 cells. (B) RT-qPCR analysis of MMP1 mRNA expression was performed in A1207-LacZ and A1207-GBP1 cells (left). Reporter assays were performed to analyze the effect of GBP1 expression on MMP1 promoter activation in the A1207 cells (right). The cells were transfected with pGL3-MMP1 (2,942 bp) and pRL-TK for 48 h. Firefly and Renilla luciferase activities were measured, and promoter activity is presented as the fold induction of RLU as compared with the control. This result is expressed as the mean of three independent experiments ± SD. *, P < 0.01. (C) The expression of the protein was analyzed by Western blot in siRNA-Luc (control)– and siRNA-MMP1–transfected A1207-GBP1 cells. (D) Cell invasion was analyzed by BioCoat Matrigel invasion chambers. A1207-lacZ, A1207-GBP1, A1207-GBP1/siRNA-Luc, or A1207-GBP1/siRNA-MMP1 cells were plated at a density of 2.0 × 10⁴ per insert. Medium with 10% FBS was in the lower chamber as a chemoattractant. After 22 h, invasive cells on the lower surface were counted after fixing and staining. Shown are representative data of at least two independent experiments. Bar, 100 µm. (E) The expression of MMP1, GBP1, and dominant-negative mutants (D184N and R48P) of GBP1 in A1207 cells was analyzed by Western blot. (F) Zymography analysis of the MMP1 activity in A1207 cells expressing GBP1 or its mutants D184N and R48P. (G) Schematic representation of the retroviral expression vector pBABE-puro encoding individual domains of GBP1: N-terminal globular domain (Glo-GBP1; Glo) and C-terminal helical domain (Hel-GBP1; Hel). The numbers refer to the positions of the amino acids in GBP1. (H) Effect of Flag-tagged GBP1 and truncated Glo and Hel on the expression of MMP1 in A1207 cells were analyzed by Western blot. (I) Quantitative results for the invasive ability of A1207 cells expressing GBP1 or two different truncated domains Glo and Hel as assessed by BioCoat Matrigel invasion chambers as described in D. Data are representative of three independent experiments. Error bars represent SD.
Figure 8.
Figure 8.
Targeting GBP1 inhibits glioblastoma invasion in vivo. (A) Western blot analysis of MMP1 and GBP1 in cell lysates (CL) and of MMP1 in conditioned medium (CM) of SNB19-shGFP and -shGBP1 cells with or without 20 ng/ml EGF stimulation for 24 h. (B) RT-qPCR analysis of GBP1 (left) and MMP1 (middle) mRNA expression in SNB19-shGFP and SNB19–shGBP1 cells with or without PBS or 20 ng/ml EGF stimulation for 6 h. (right) The human MMP1 promoter activity was determined by transfecting with pGL3-MMP1 (2,942 bp) and pRL-TK (internal control) in the shRNA-transfected SNB19 cells with or without PBS or 20 ng/ml EGF treatment for 6 h. Firefly and Renilla luciferase activities were measured, and promoter activity is presented as the fold induction of RLU as compared with the control. This result is expressed as the mean of three independent experiments ± SD. *, P < 0.05; #, P < 0.01. (C) H&E, GBP1, and MMP1 staining of brain sections on day 20 after intracranial inoculation of SNB19-shGFP (left) or SNB19-shGBP1 (right; 1 × 10⁶ cells/mouse). Shown are representative brain slices from tumor-bearing mice. Tumor margins are delineated using a dotted line. Arrowheads denote invasive extensions from tumor mass (T). Arrows indicate invasive tumor cells and disseminated tumor clusters away from the tumor mass. The animal experiments were performed two independent times with 10 mice per group with similar results. (D) Representative image showing perivascular infiltrations in SNB19-shGFP (left) but not SNB19-shGBP1 (right) tumor-bearing mice. Bars, 50 µm. (E) Quantification of the infiltrating tumor masses observed in SNB19-shGFP and SNB19-shGBP1 tumor-bearing mice on day 20 (n = 10; *, P < 0.05). Data are representative of two independent experiments. Error bars represent SD.
Figure 9.
Figure 9.
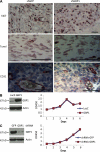
Effect of GBP1 on glioblastoma cell growth in vivo and in vitro. (A) Shown is the representative Ki67, Tunel, and CD31 staining image of the tumor mass of SNB19-shGFP (left) and SNB19-shGBP1 (right) on day 20 after intracranial inoculation. Data are representative of two independent experiments. Bars, 50 µm. (B and C) WST-1 assay was performed to examine the effect of overexpression of GBP1 on A1207 cell proliferation (B) and the effect of knockdown of GBP1 by shRNA on U178 cell proliferation (C). Data are representative of three independent experiments. Error bars represent SD.

Similar articles

Cited by

References

    1. Angers-Loustau A., Hering R., Werbowetski T.E., Kaplan D.R., Del Maestro R.F. 2004. SRC regulates actin dynamics and invasion of malignant glial cells in three dimensions. Mol. Cancer Res. 2:595–605 - PubMed
    1. Armstrong D.A., Phelps L.N., Vincenti M.P. 2009. CCAAT enhancer binding protein-beta regulates matrix metalloproteinase-1 expression in interleukin-1beta-stimulated A549 lung carcinoma cells. Mol. Cancer Res. 7:1517–1524 10.1158/1541-7786.MCR-09-0082 - DOI - PubMed
    1. Battle T.E., Frank D.A. 2002. The role of STATs in apoptosis. Curr. Mol. Med. 2:381–392 10.2174/1566524023362456 - DOI - PubMed
    1. Bellail A.C., Hunter S.B., Brat D.J., Tan C., Van Meir E.G. 2004. Microregional extracellular matrix heterogeneity in brain modulates glioma cell invasion. Int. J. Biochem. Cell Biol. 36:1046–1069 10.1016/j.biocel.2004.01.013 - DOI - PubMed
    1. Cai X.M., Tao B.B., Wang L.Y., Liang Y.L., Jin J.W., Yang Y., Hu Y.L., Zha X.L. 2005. Protein phosphatase activity of PTEN inhibited the invasion of glioma cells with epidermal growth factor receptor mutation type III expression. Int. J. Cancer. 117:905–912 10.1002/ijc.21251 - DOI - PubMed

Publication types

MeSH terms

Associated data