. 2011 Dec;9(12):e1001213.
doi: 10.1371/journal.pbio.1001213. Epub 2011 Dec 6.

Microtubules in bacteria: Ancient tubulins build a five-protofilament homolog of the eukaryotic cytoskeleton

Affiliations

Microtubules in bacteria: Ancient tubulins build a five-protofilament homolog of the eukaryotic cytoskeleton

Martin Pilhofer et al. PLoS Biol. 2011 Dec.

Abstract

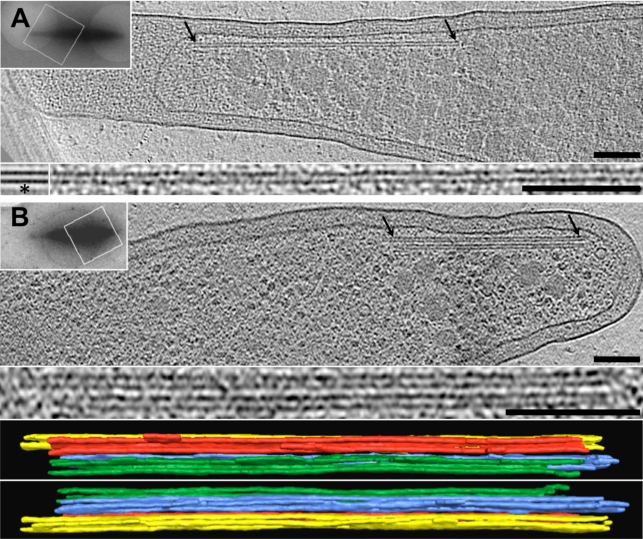
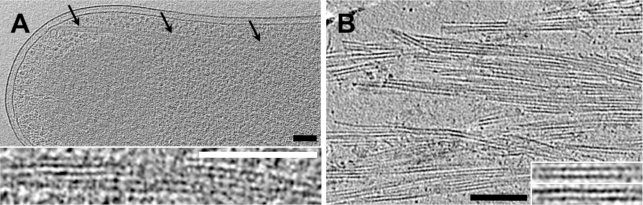
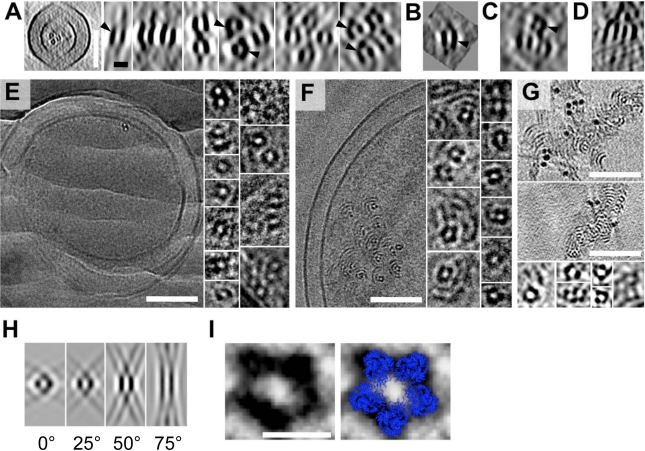
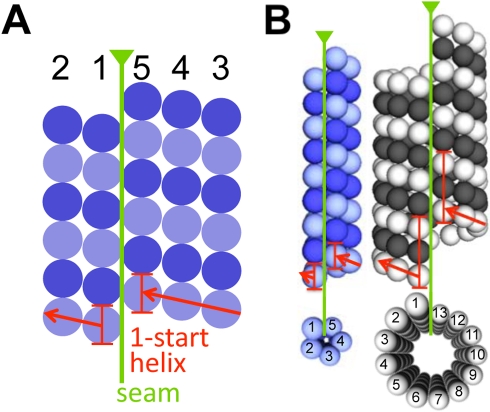
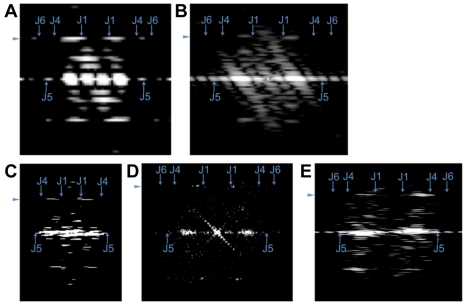
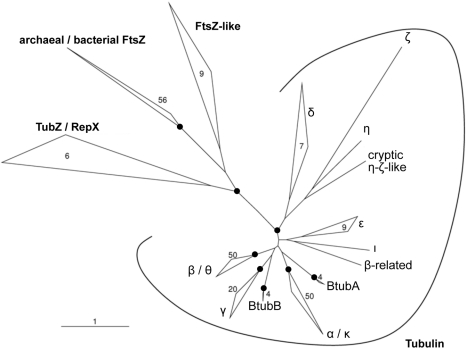
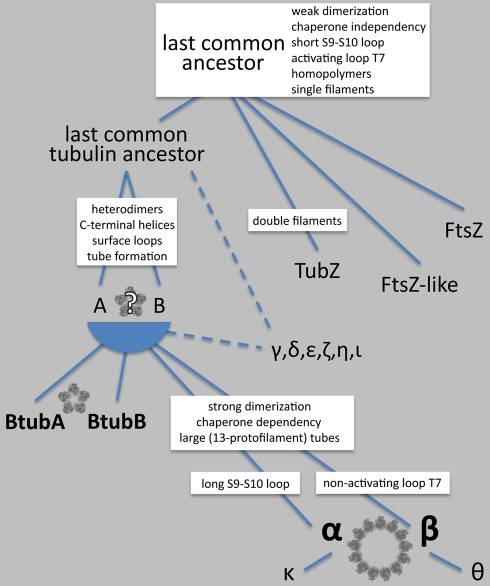
Microtubules play crucial roles in cytokinesis, transport, and motility, and are therefore superb targets for anti-cancer drugs. All tubulins evolved from a common ancestor they share with the distantly related bacterial cell division protein FtsZ, but while eukaryotic tubulins evolved into highly conserved microtubule-forming heterodimers, bacterial FtsZ presumably continued to function as single homopolymeric protofilaments as it does today. Microtubules have not previously been found in bacteria, and we lack insight into their evolution from the tubulin/FtsZ ancestor. Using electron cryomicroscopy, here we show that the tubulin homologs BtubA and BtubB form microtubules in bacteria and suggest these be referred to as "bacterial microtubules" (bMTs). bMTs share important features with their eukaryotic counterparts, such as straight protofilaments and similar protofilament interactions. bMTs are composed of only five protofilaments, however, instead of the 13 typical in eukaryotes. These and other results suggest that rather than being derived from modern eukaryotic tubulin, BtubA and BtubB arose from early tubulin intermediates that formed small microtubules. Since we show that bacterial microtubules can be produced in abundance in vitro without chaperones, they should be useful tools for tubulin research and drug screening.


Conflict of interest statement

The authors have declared that no competing interests exist.

Figures

Figure 1
Figure 1. Cytoskeletal BtubA/B-candidate structures imaged in Prosthecobacter.
Prosthecobacter vanneervenii cells showing tube-like BtubA/B-candidate structures occurring (A) individually or (B) in a bundle. Shown are 11-nm thick slices through cryotomograms. Arrows indicate cytoskeletal structures, which are also shown enlarged below. Asterisk in panel A identifies a sub-tomographic average. Upper-left insets show low-magnification overviews of the cells; rectangles indicate areas imaged in 3-D. Bottom: 3-D segmentation of the bundle of panel B shown from two views (four tubes are present). Scale bars are 100 nm. See Figure S3 for further examples of BtubA/B structures.
Figure 2
Figure 2. Recombinant BtubA/B structures resemble the tube-like structures imaged in Prosthecobacter.
(A) E. coli cell co-expressing BtubA and BtubB (from P. dejongeii) and (B) recombinant BtubA/B polymerized in vitro exhibiting tube-like densities which are strikingly similar to those seen in Prosthecobacter. Shown are 11-nm thick slices through electron cryotomograms. Arrows indicate cytoskeletal structures. Black scale bars and white scale bar (applies to enlarged images) are 100 nm.
Figure 3
Figure 3. BtubA/B assembles into five-protofilament tubes.
(A–D) Tomographic slices showing cross-sectional views of BtubA/B tubes in (A) prosthecobacters, (B) a sub-tomographic average from P. vanneervenii, (C) E. coli co-expressing BtubA/B (from P. vanneervenii), and (D) BtubA/B polymerized in vitro. (E, F) Images and (G) tomographic slices through cryosectioned, high-pressure-frozen (E) P. vanneervenii cells, (F) E. coli cells co-expressing BtubA/B, and (G) BtubA/B polymerized in vitro, showing that the BtubA/B structures are complete tubes. (H) Slices through simulated tomograms showing cross-sectional views of five-protofilament tube models lying in a plane perpendicular to the electron beam at different angles to the tilt-axis (from left to right 0°, 25°, 50°, 75°), showing how the well-known missing wedge effect recapitulates the apparent lack of density in the tops and bottoms of the tubes seen in the tomograms. (I) Pseudo-atomic model of a five-protofilament bacterial microtubule (blue; built from Protein Data Bank structure 2 btq) superimposed on the image of a cryo-sectioned BtubA/B tube (left). The tomographic slices are (A, C) 114 nm, (B, H) 11 nm, (D) 76 nm, and (G) 88 nm thick. The black scale bar is 10 nm and applies to enlarged images and simulations in panels A–H; white scale bars are 100 nm in panels E–G and 10 nm in panel I.
Figure 4
Figure 4. Structural model of “bacterial microtubules.”
(A) 2-D schematic of the proposed architecture of bacterial microtubules built from BtubA (dark-blue) and BtubB (light-blue). Protofilaments are numbered 1–5. (B) 3-D comparison of the architectures of a bacterial microtubule (left; BtubA in dark-blue; BtubB in light-blue) and a 13-protofilament eukaryotic microtubule (right; β-tubulin in black; α-tubulin in white). Seams and start-helices are indicated as in (A).
Figure 5
Figure 5. BtubA/B tubes have a helical, microtubule-like lattice.
(A) Fourier transform of a simulated projection image (1.2 nm/pixel) of a five-protofilament BtubA/B-tube model (Figure 4) with a helical, microtubule-like lattice. A prominent pair of elongated spots on the subunit-repeat layer line on either side of the meridian corresponds to the helical family J1. Pairs of spots for the helical families J4 and J6 were very weak, likely because of destructive interference with the first minimum of the J1 Bessel-function. The subunit-repeat layer line was surprisingly asymmetric probably because of the small number of protofilaments and the resulting lack of an extended “front” and ”back” side. The asymmetry also shifted around the meridian depending on the rotation of the tube around its length axis (Figure S10). (B–E) Fourier transforms of BtubA/B-tubes in (B) a 2-D slice through a subtomogram average (from within a P. vanneervenii cell), (C) a negatively stained projection image (of an in vitro assembled tube), (D) a cryo-EM projection image (of an in vitro assembled tube), and (E) a 2-D tomographic slice containing an in vitro assembled tube. The prominent pair of J1 spots on the subunit repeat layer line in all cases suggests a helical lattice, as all non-helical models lead to high-intensity spots on the meridian (unpublished data). Arrowheads indicate the subunit repeat layer line. Arrows mark the maxima of the J1, J4, J5, and J6 Bessel-functions, assuming outer rather than mass-weighted radii (and therefore marking the expected meridional borders of spots).
Figure 6
Figure 6. BtubA and BtubB represent two novel tubulin subfamilies in the eukaryotic clade of tubulins.
In global phylogenetic analyses of the FtsZ/Tubulin superfamily, BtubA and BtubB stably clustered within the clade of eukaryotic tubulin subfamilies (i.e., the Tubulin family). A second stable group of sequences comprised bacterial and archaeal tubulin homologues (FtsZ, FtsZ-like, TubZ, RepX). The relationships between tubulin subfamilies were instable (except β-θ and α-κ). Here and in further phylogenetic analyses (Figure S11, Tables S1 and S2, and Materials and Methods) no stable associations between BtubA or BtubB and any tubulin subfamily were detected, in agreement with a previous less comprehensive study . Shown is one representative maximum likelihood tree calculated using a 10% minimum similarity filter. A black circle indicates that the respective node/group was stable in different trees. Bar represents 1% estimated evolutionary distance. Numbers indicate how many sequences were included in a closed group.
Figure 7
Figure 7. Model for the evolution of BtubA/B.
Tubulins, FtsZ, FtsZ-like, and TubZ all evolved from a common ancestor with the likely properties listed ,,–. In contrast to the bacterial FtsZ, FtsZ-like, and TubZ proteins, the last common tubulin ancestor appears to have evolved to form heterodimers (consisting of “A”- and “B”-tubulins) with properties that enabled tube formation. Modern α- and β-tubulin further localized the activating T7 and short S9, S10 loop into different subunits, developed a need for chaperones, and began to form larger, ∼13-protofilament microtubules. In contrast, BtubA and BtubB retained ancient features shared by FtsZ such as chaperone independence, weak dimerization, and both an activating T7 loop and short S9, S10 loop in both subunits ,,. The smaller, five-protofilament, one-start-helical architecture of the bacterial microtubule is therefore likely a primordial form. The ancestry of the other supplemental tubulins γ through κ is unclear, except that θ- and κ-tubulins derived from β and α, respectively.

References

    1. Nogales E. Structural insights into microtubule function. Annu Rev Biochem. 2000;69:277–302. - PubMed
    1. Nogales E, Whittaker M, Milligan R. A, Downing K. H. High-resolution model of the microtubule. Cell. 1999;96:79–88. - PubMed
    1. Bermudes D, Hinkle G, Margulis L. Do prokaryotes contain microtubules? Microbiol Rev. 1994;58:387–400. - PMC - PubMed
    1. Amos L. A, Schlieper D. Microtubules and maps. Adv Protein Chem. 2005;71:257–298. - PubMed
    1. Erickson H. P. FtsZ, a prokaryotic homolog of tubulin. Cell. 1995;80:367–370. - PubMed

Publication types