Accurate genome relative abundance estimation based on shotgun metagenomic reads
- PMID: 22162995
- PMCID: PMC3232206
- DOI: 10.1371/journal.pone.0027992
Accurate genome relative abundance estimation based on shotgun metagenomic reads
Abstract
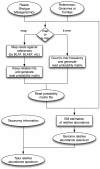
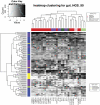
Accurate estimation of microbial community composition based on metagenomic sequencing data is fundamental for subsequent metagenomics analysis. Prevalent estimation methods are mainly based on directly summarizing alignment results or its variants; often result in biased and/or unstable estimates. We have developed a unified probabilistic framework (named GRAMMy) by explicitly modeling read assignment ambiguities, genome size biases and read distributions along the genomes. Maximum likelihood method is employed to compute Genome Relative Abundance of microbial communities using the Mixture Model theory (GRAMMy). GRAMMy has been demonstrated to give estimates that are accurate and robust across both simulated and real read benchmark datasets. We applied GRAMMy to a collection of 34 metagenomic read sets from four metagenomics projects and identified 99 frequent species (minimally 0.5% abundant in at least 50% of the data-sets) in the human gut samples. Our results show substantial improvements over previous studies, such as adjusting the over-estimated abundance for Bacteroides species for human gut samples, by providing a new reference-based strategy for metagenomic sample comparisons. GRAMMy can be used flexibly with many read assignment tools (mapping, alignment or composition-based) even with low-sensitivity mapping results from huge short-read datasets. It will be increasingly useful as an accurate and robust tool for abundance estimation with the growing size of read sets and the expanding database of reference genomes.
Conflict of interest statement
Figures


References
-
- Venter JC, Remington K, Heidelberg JF, Halpern AL, Rusch D, et al. Environmental genome shotgun sequencing of the Sargasso Sea. Science. 2004;304:66–74. - PubMed
-
- Tyson GW, Chapman J, Hugenholtz P, Allen EE, Ram RJ, et al. Community structure and metabolism through reconstruction of microbial genomes from the environment. Nature. 2004;428:37–43. - PubMed
Publication types
MeSH terms
LinkOut - more resources
Full Text Sources
Other Literature Sources

