

Chromosome 3 anomalies investigated by genome wide SNP analysis of benign, low malignant potential and low grade ovarian serous tumours
- PMID: 22163003
- PMCID: PMC3232202
- DOI: 10.1371/journal.pone.0028250
Chromosome 3 anomalies investigated by genome wide SNP analysis of benign, low malignant potential and low grade ovarian serous tumours
Abstract
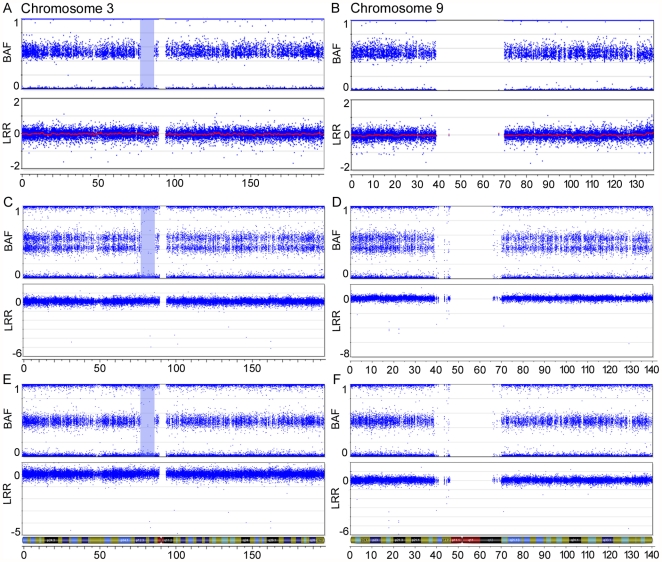
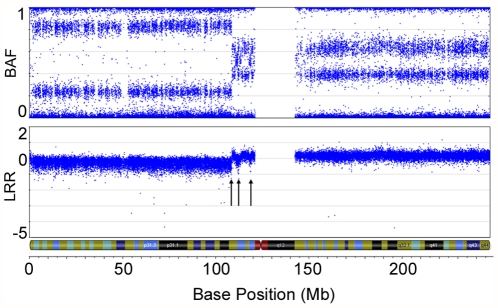
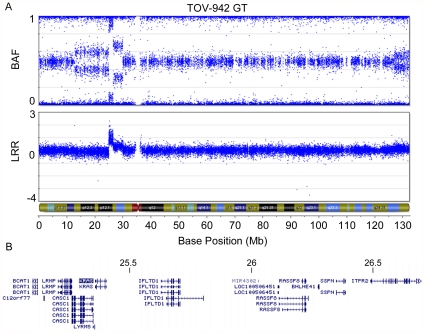
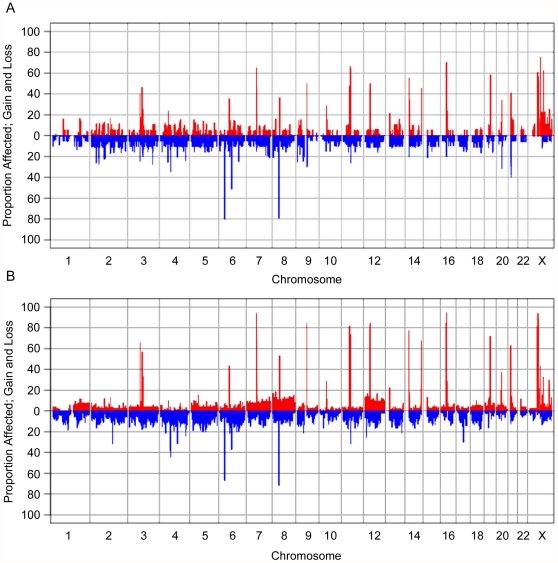
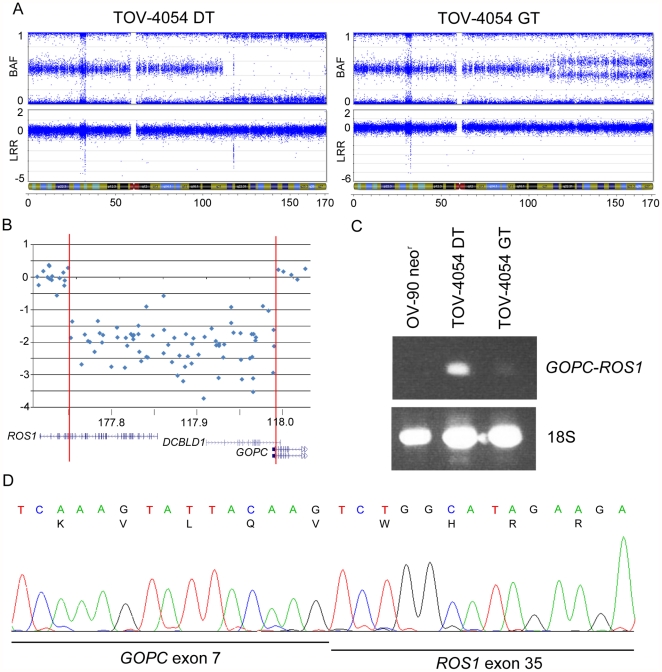
Ovarian carcinomas exhibit extensive heterogeneity, and their etiology remains unknown. Histological and genetic evidence has led to the proposal that low grade ovarian serous carcinomas (LGOSC) have a different etiology than high grade carcinomas (HGOSC), arising from serous tumours of low malignant potential (LMP). Common regions of chromosome (chr) 3 loss have been observed in all types of serous ovarian tumours, including benign, suggesting that these regions contain genes important in the development of all ovarian serous carcinomas. A high-density genome-wide genotyping bead array technology, which assayed >600,000 markers, was applied to a panel of serous benign and LMP tumours and a small set of LGOSC, to characterize somatic events associated with the most indolent forms of ovarian disease. The genomic patterns inferred were related to TP53, KRAS and BRAF mutations. An increasing frequency of genomic anomalies was observed with pathology of disease: 3/22 (13.6%) benign cases, 40/53 (75.5%) LMP cases and 10/11 (90.9%) LGOSC cases. Low frequencies of chr3 anomalies occurred in all tumour types. Runs of homozygosity were most commonly observed on chr3, with the 3p12-p11 candidate tumour suppressor region the most frequently homozygous region in the genome. An LMP harboured a homozygous deletion on chr6 which created a GOPC-ROS1 fusion gene, previously reported as oncogenic in other cancer types. Somatic TP53, KRAS and BRAF mutations were not observed in benign tumours. KRAS-mutation positive LMP cases displayed significantly more chromosomal aberrations than BRAF-mutation positive or KRAS and BRAF mutation negative cases. Gain of 12p, which harbours the KRAS gene, was particularly evident. A pathology review reclassified all TP53-mutation positive LGOSC cases, some of which acquired a HGOSC status. Taken together, our results support the view that LGOSC could arise from serous benign and LMP tumours, but does not exclude the possibility that HGOSC may derive from LMP tumours.
Conflict of interest statement
Figures
Similar articles
-
BRAF mutation is rare in advanced-stage low-grade ovarian serous carcinomas.Am J Pathol. 2010 Oct;177(4):1611-7. doi: 10.2353/ajpath.2010.100212. Epub 2010 Aug 27. Am J Pathol. 2010. PMID: 20802181 Free PMC article.
-
Molecular profiling of low grade serous ovarian tumours identifies novel candidate driver genes.Oncotarget. 2015 Nov 10;6(35):37663-77. doi: 10.18632/oncotarget.5438. Oncotarget. 2015. PMID: 26506417 Free PMC article.
-
Numerical abnormalities of chromosomes 1, 11, 17, and X are associated with stromal invasion in serous and mucinous epithelial ovarian tumours.J Pathol. 1999 Sep;189(1):53-9. doi: 10.1002/(SICI)1096-9896(199909)189:1<53::AID-PATH393>3.0.CO;2-U. J Pathol. 1999. PMID: 10451488
-
Ovarian carcinomas: at least five different diseases with distinct histological features and molecular genetics.Hum Pathol. 2018 Oct;80:11-27. doi: 10.1016/j.humpath.2018.06.018. Epub 2018 Jun 23. Hum Pathol. 2018. PMID: 29944973 Review.
-
Low Grade Serous Ovarian Carcinoma: from the molecular characterization to the best therapeutic strategy.Cancer Treat Rev. 2015 Feb;41(2):136-43. doi: 10.1016/j.ctrv.2014.12.003. Epub 2014 Dec 23. Cancer Treat Rev. 2015. PMID: 25573350 Review.
Cited by
-
The rationale for druggability of CCDC6-tyrosine kinase fusions in lung cancer.Mol Cancer. 2018 Feb 19;17(1):46. doi: 10.1186/s12943-018-0799-8. Mol Cancer. 2018. PMID: 29455670 Free PMC article. Review.
-
Biomarkers That Currently Affect Clinical Practice in Lung Cancer: EGFR, ALK, MET, ROS-1, and KRAS.Front Oncol. 2014 Aug 11;4:204. doi: 10.3389/fonc.2014.00204. eCollection 2014. Front Oncol. 2014. PMID: 25157335 Free PMC article. Review.
-
Routine Clinically Detected Increased ROS1 Transcripts Are Related With ROS1 Expression by Immunohistochemistry and Associated With EGFR Mutations in Lung Adenocarcinoma.JTO Clin Res Rep. 2023 May 24;4(7):100530. doi: 10.1016/j.jtocrr.2023.100530. eCollection 2023 Jul. JTO Clin Res Rep. 2023. PMID: 37415647 Free PMC article.
-
Detection of ROS1 rearrangement in non-small cell lung cancer: current and future perspectives.Lung Cancer (Auckl). 2017 Jul 7;8:45-55. doi: 10.2147/LCTT.S120172. eCollection 2017. Lung Cancer (Auckl). 2017. PMID: 28740441 Free PMC article. Review.
-
Long time response with chemotherapy in ROS1 NSCLC patient with unusual metastatic site.Cancer Biol Ther. 2016 Oct 2;17(10):1089-1093. doi: 10.1080/15384047.2016.1219822. Epub 2016 Sep 10. Cancer Biol Ther. 2016. PMID: 27611848 Free PMC article.
References
-
- Chen VW, Ruiz B, Killeen JL, Cote TR, Wu XC, et al. Pathology and classification of ovarian tumors. Cancer. 2003;97:2631–2642. - PubMed
-
- Trimble CL, Kosary C, Trimble EL. Long-term survival and patterns of care in women with ovarian tumors of low malignant potential. Gynecol Oncol. 2002;86:34–37. - PubMed
-
- Crispens MA, Bodurka D, Deavers M, Lu K, Silva EG, et al. Response and survival in patients with progressive or recurrent serous ovarian tumors of low malignant potential. Obstet Gynecol. 2002;99:3–10. - PubMed
-
- Schmeler KM, Sun CC, Bodurka DC, Deavers MT, Malpica A, et al. Neoadjuvant chemotherapy for low-grade serous carcinoma of the ovary or peritoneum. Gynecol Oncol. 2008;108:510–514. - PubMed
Publication types
MeSH terms
Grants and funding
LinkOut - more resources
Full Text Sources
Other Literature Sources
Medical
Research Materials
Miscellaneous
