

Mislocalization of visual stimuli: independent effects of static and dynamic attention
- PMID: 22163009
- PMCID: PMC3230626
- DOI: 10.1371/journal.pone.0028371
Mislocalization of visual stimuli: independent effects of static and dynamic attention
Abstract
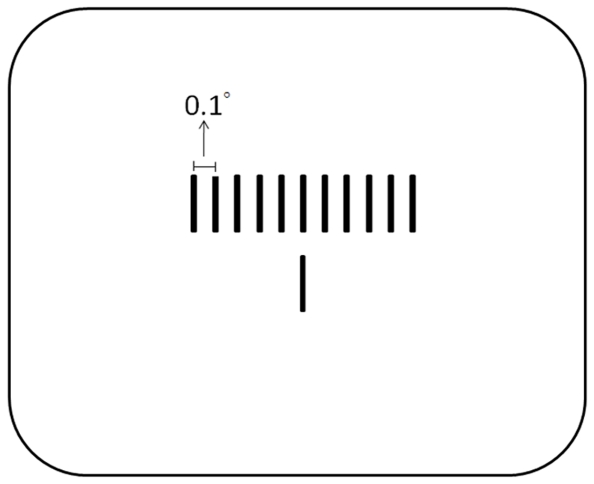
Shifts of visual attention cause systematic distortions of the perceived locations of visual objects around the focus of attention. In the attention repulsion effect, the perceived location of a visual target is shifted away from an attention-attracting cue when the cue is presented before the target. Recently it has been found that, if the visual cue is presented after the target, the perceived location of the target shifts toward the location of the following cue. One unanswered question is whether a single mechanism underlies both attentional repulsion and attraction effects. We presented participants with two disks at diagonal locations as visual cues and two vertical lines as targets. Participants were asked to perform a forced-choice task to judge targets' positions. The present study examined whether the magnitude of the repulsion effect and the attraction effect would differ (Experiment 1), whether the two effects would interact (Experiment 2), and whether the location or the dynamic shift of attentional focus would determine the distortions effects (Experiment 3). The results showed that the effect size of the attraction effect was slightly larger than the repulsion effect and the preceding and following cues have independent influences on the perceived positions. The repulsion effect was caused by the location of attnetion and the attraction effect was due to the dynamic shift of attentional focus, suggesting that the underlying mechanisms for the retrospective attraction effect might be different from those for the repulsion effect.
Conflict of interest statement
Figures


Similar articles
-
The attentional repulsion effect and relative size judgments.Atten Percept Psychophys. 2019 Feb;81(2):442-461. doi: 10.3758/s13414-018-1612-x. Atten Percept Psychophys. 2019. PMID: 30488191 Free PMC article.
-
Attention can retrospectively distort visual space.Psychol Sci. 2011 Apr;22(4):472-7. doi: 10.1177/0956797611403319. Epub 2011 Mar 24. Psychol Sci. 2011. PMID: 21441225
-
Temporal course of position shift for a peripheral target.J Vis. 2011 May 11;11(6):6. doi: 10.1167/11.6.6. J Vis. 2011. PMID: 21562033
-
Depth modulation of the attentional repulsion effect.Perception. 2013;42(12):1333-43. doi: 10.1068/p7580. Perception. 2013. PMID: 24649635
-
Attentional repulsion effects produced by feature-guided shifts of attention.J Vis. 2020 Mar 17;20(3):10. doi: 10.1167/jov.20.3.10. J Vis. 2020. PMID: 32232375 Free PMC article.
Cited by
-
Temporal context affects the perceived time of visual events.Psychon Bull Rev. 2020 Feb;27(1):56-61. doi: 10.3758/s13423-019-01682-x. Psychon Bull Rev. 2020. PMID: 31808047 Free PMC article.
-
Retrospective perceptual distortion of position representation does not lead to delayed localization.Adv Cogn Psychol. 2013 Mar 15;9(1):20-31. doi: 10.2478/v10053-008-0128-7. Print 2013. Adv Cogn Psychol. 2013. PMID: 23717348 Free PMC article.
-
The attentional repulsion effect and relative size judgments.Atten Percept Psychophys. 2019 Feb;81(2):442-461. doi: 10.3758/s13414-018-1612-x. Atten Percept Psychophys. 2019. PMID: 30488191 Free PMC article.
References
-
- Posner MI, Peterson SE. The attention system of the human brain. Annual Review of Neuroscience. 1990;13:25–42. - PubMed
-
- He S, Cavanagh P, Intriligator J. Attentional resolution and the locus of awareness. Nature. 1996;383:334–338. - PubMed
-
- Suzuki S, Cavanagh P. Focused attention distorts visual space: an attentional repulsion effect. Journal of Experimental Psychology: Human Perception and Performance. 1997;23:443–463. - PubMed
-
- Arnott SR, Goodale MA. Distorting visual space with sound. Vision Research. 2006;46:1553–1558. - PubMed
Publication types
MeSH terms
LinkOut - more resources
Full Text Sources
