

How molecular competition influences fluxes in gene expression networks
- PMID: 22163025
- PMCID: PMC3230629
- DOI: 10.1371/journal.pone.0028494
How molecular competition influences fluxes in gene expression networks
Abstract
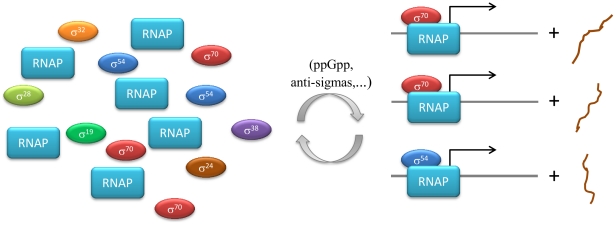
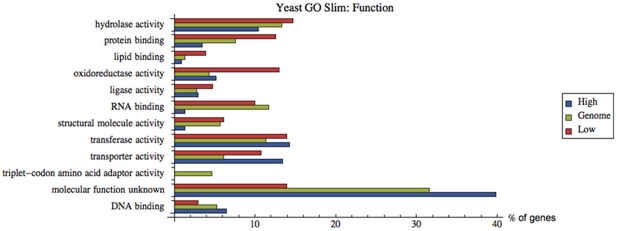
Often, in living cells different molecular species compete for binding to the same molecular target. Typical examples are the competition of genes for the transcription machinery or the competition of mRNAs for the translation machinery. Here we show that such systems have specific regulatory features and how they can be analysed. We derive a theory for molecular competition in parallel reaction networks. Analytical expressions for the response of network fluxes to changes in the total competitor and common target pools indicate the precise conditions for ultrasensitivity and intuitive rules for competitor strength. The calculations are based on measurable concentrations of the competitor-target complexes. We show that kinetic parameters, which are usually tedious to determine, are not required in the calculations. Given their simplicity, the obtained equations are easily applied to networks of any dimension. The new theory is illustrated for competing sigma factors in bacterial transcription and for a genome-wide network of yeast mRNAs competing for ribosomes. We conclude that molecular competition can drastically influence the network fluxes and lead to negative response coefficients and ultrasensitivity. Competitors that bind a large fraction of the target, like bacterial σ(70), tend to influence competing pathways strongly. The less a competitor is saturated by the target, the more sensitive it is to changes in the concentration of the target, as well as to other competitors. As a consequence, most of the mRNAs in yeast turn out to respond ultrasensitively to changes in ribosome concentration. Finally, applying the theory to a genome-wide dataset we observe that high and low response mRNAs exhibit distinct Gene Ontology profiles.
Conflict of interest statement
Figures
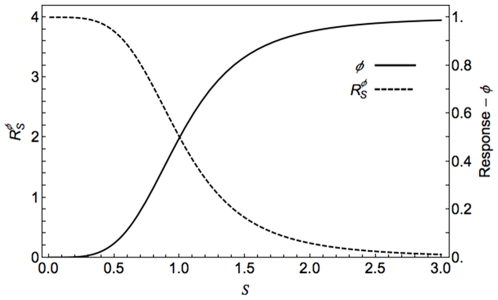
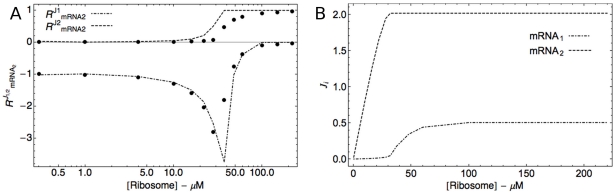
 ) and the response coefficient towards a change in substrate concentration S (
 ) are plotted as a function of the substrate concentration (assuming excess substrate over enzyme).
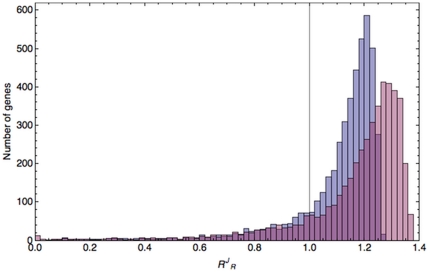
 values for two cases. The first distribution (blue bars) was produced by including genome-scale ribosome occupancy values in the calculations; the second (purple bars) was produced assuming ribosome occupancies equal to 1 (more details on the calculations in the Methods section). The vertical line was positioned at
  = 1.
= 1.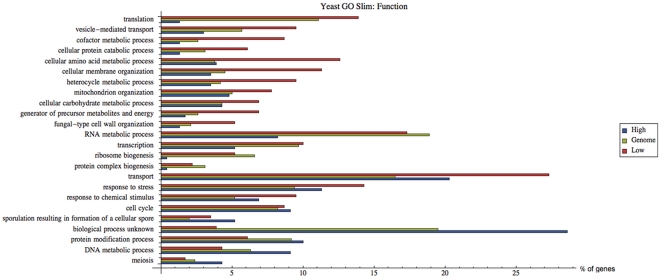
Similar articles
-
Translational cross talk in gene networks.Biophys J. 2013 Jun 4;104(11):2564-72. doi: 10.1016/j.bpj.2013.04.049. Biophys J. 2013. PMID: 23746529 Free PMC article.
-
An algorithmic framework for genome-wide modeling and analysis of translation networks.Biophys J. 2006 Feb 15;90(4):1136-46. doi: 10.1529/biophysj.105.062521. Epub 2005 Nov 18. Biophys J. 2006. PMID: 16299083 Free PMC article.
-
Reconstructing genome-wide regulatory network of E. coli using transcriptome data and predicted transcription factor activities.BMC Bioinformatics. 2011 Jun 13;12:233. doi: 10.1186/1471-2105-12-233. BMC Bioinformatics. 2011. PMID: 21668997 Free PMC article.
-
Competing endogenous RNAs: a target-centric view of small RNA regulation in bacteria.Nat Rev Microbiol. 2016 Dec;14(12):775-784. doi: 10.1038/nrmicro.2016.129. Epub 2016 Sep 19. Nat Rev Microbiol. 2016. PMID: 27640758 Review.
-
[Factors limiting the gene expression of Escherichia coli in the cells of bacilli].Genetika. 1983 May;19(5):693-707. Genetika. 1983. PMID: 6192041 Review. Russian.
Cited by
-
Germline NPM1 mutations lead to altered rRNA 2'-O-methylation and cause dyskeratosis congenita.Nat Genet. 2019 Oct;51(10):1518-1529. doi: 10.1038/s41588-019-0502-z. Epub 2019 Sep 30. Nat Genet. 2019. PMID: 31570891 Free PMC article.
-
Translational cross talk in gene networks.Biophys J. 2013 Jun 4;104(11):2564-72. doi: 10.1016/j.bpj.2013.04.049. Biophys J. 2013. PMID: 23746529 Free PMC article.
-
Competing endogenous RNA crosstalk at system level.PLoS Comput Biol. 2019 Nov 1;15(11):e1007474. doi: 10.1371/journal.pcbi.1007474. eCollection 2019 Nov. PLoS Comput Biol. 2019. PMID: 31675359 Free PMC article.
-
Living on the edge: substrate competition explains loss of robustness in mitochondrial fatty-acid oxidation disorders.BMC Biol. 2016 Dec 7;14(1):107. doi: 10.1186/s12915-016-0327-5. BMC Biol. 2016. PMID: 27927213 Free PMC article.
-
Ultrasensitive response motifs: basic amplifiers in molecular signalling networks.Open Biol. 2013 Apr 24;3(4):130031. doi: 10.1098/rsob.130031. Open Biol. 2013. PMID: 23615029 Free PMC article. Review.
References
-
- Tyson JJ, Chen KC, Novak B. Sniffers, buzzers, toggles and blinkers: dynamics of regulatory and signaling pathways in the cell. Curr Opin Cell Biol. 2003;15:221–231. - PubMed
-
- Alon U. Network motifs: theory and experimental approaches. Nat Rev Genet. 2007;8:450–461. - PubMed
-
- Maaloe O. Regulation of the protein synthesizing machinery – ribosomes, tRNA, factors and so on. In: Goldberger RF, editor. Biological regulation and development. New York: Plenum Publishing Corp; 1979. pp. 487–542.
-
- Warner J. The economics of ribosome biosynthesis in yeast. TIBS. 1999;24:437–440. - PubMed
-
- Lovmar M, Ehrenberg M. Rate, accuracy and cost of ribosomes in bacterial cells. Biochimie. 2006;88:951–961. - PubMed
Publication types
MeSH terms
Substances
Grants and funding
LinkOut - more resources
Full Text Sources
Molecular Biology Databases
Research Materials
