Tissue tropism and target cells of NSs-deleted rift valley fever virus in live immunodeficient mice
- PMID: 22163058
- PMCID: PMC3232203
- DOI: 10.1371/journal.pntd.0001421
Tissue tropism and target cells of NSs-deleted rift valley fever virus in live immunodeficient mice
Abstract
Background: Rift Valley fever virus (RVFV) causes disease in livestock and humans. It can be transmitted by mosquitoes, inhalation or physical contact with the body fluids of infected animals. Severe clinical cases are characterized by acute hepatitis with hemorrhage, meningoencephalitis and/or retinitis. The dynamics of RVFV infection and the cell types infected in vivo are poorly understood.
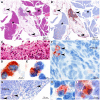
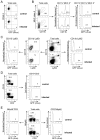
Methodology/principal findings: RVFV strains expressing humanized Renilla luciferase (hRLuc) or green fluorescent protein (GFP) were generated and inoculated to susceptible Ifnar1-deficient mice. We investigated the tissue tropism in these mice and the nature of the target cells in vivo using whole-organ imaging and flow cytometry. After intraperitoneal inoculation, hRLuc signal was observed primarily in the thymus, spleen and liver. Macrophages infiltrating various tissues, in particular the adipose tissue surrounding the pancreas also expressed the virus. The liver rapidly turned into the major luminescent organ and the mice succumbed to severe hepatitis. The brain remained weakly luminescent throughout infection. FACS analysis in RVFV-GFP-infected mice showed that the macrophages, dendritic cells and granulocytes were main target cells for RVFV. The crucial role of cells of the monocyte/macrophage/dendritic lineage during RVFV infection was confirmed by the slower viral dissemination, decrease in RVFV titers in blood, and prolonged survival of macrophage- and dendritic cell-depleted mice following treatment with clodronate liposomes. Upon dermal and nasal inoculations, the viral dissemination was primarily observed in the lymph node draining the injected ear and in the lungs respectively, with a significant increase in survival time.
Conclusions/significance: These findings reveal the high levels of phagocytic cells harboring RVFV during viral infection in Ifnar1-deficient mice. They demonstrate that bioluminescent and fluorescent viruses can shed new light into the pathogenesis of RVFV infection.
Conflict of interest statement
The authors have declared that no competing interests exist.
Figures


Similar articles
-
The NSs Protein Encoded by the Virulent Strain of Rift Valley Fever Virus Targets the Expression of Abl2 and the Actin Cytoskeleton of the Host, Affecting Cell Mobility, Cell Shape, and Cell-Cell Adhesion.J Virol. 2020 Dec 9;95(1):e01768-20. doi: 10.1128/JVI.01768-20. Print 2020 Dec 9. J Virol. 2020. PMID: 33087469 Free PMC article.
-
Rift Valley fever virus NSs protein promotes post-transcriptional downregulation of protein kinase PKR and inhibits eIF2alpha phosphorylation.PLoS Pathog. 2009 Feb;5(2):e1000287. doi: 10.1371/journal.ppat.1000287. Epub 2009 Feb 6. PLoS Pathog. 2009. PMID: 19197350 Free PMC article.
-
Lesions and Cellular Tropism of Natural Rift Valley Fever Virus Infection in Young Lambs.Vet Pathol. 2020 Jan;57(1):66-81. doi: 10.1177/0300985819882633. Epub 2019 Dec 17. Vet Pathol. 2020. PMID: 31842723
-
Insights into the Pathogenesis of Viral Haemorrhagic Fever Based on Virus Tropism and Tissue Lesions of Natural Rift Valley Fever.Viruses. 2021 Apr 20;13(4):709. doi: 10.3390/v13040709. Viruses. 2021. PMID: 33923863 Free PMC article. Review.
-
Single-cycle replicable Rift Valley fever virus mutants as safe vaccine candidates.Virus Res. 2016 May 2;216:55-65. doi: 10.1016/j.virusres.2015.05.012. Epub 2015 May 27. Virus Res. 2016. PMID: 26022573 Free PMC article. Review.
Cited by
-
Lrp1 is a host entry factor for Rift Valley fever virus.Cell. 2021 Sep 30;184(20):5163-5178.e24. doi: 10.1016/j.cell.2021.09.001. Epub 2021 Sep 23. Cell. 2021. PMID: 34559985 Free PMC article.
-
β-Catenin Upregulates the Constitutive and Virus-Induced Transcriptional Capacity of the Interferon Beta Promoter through T-Cell Factor Binding Sites.Mol Cell Biol. 2015 Oct 12;36(1):13-29. doi: 10.1128/MCB.00641-15. Print 2016 Jan 1. Mol Cell Biol. 2015. PMID: 26459757 Free PMC article.
-
Rift Valley fever virus clearance and protection from neurologic disease are dependent on CD4+ T cell and virus-specific antibody responses.J Virol. 2013 Jun;87(11):6161-71. doi: 10.1128/JVI.00337-13. Epub 2013 Mar 27. J Virol. 2013. PMID: 23536675 Free PMC article.
-
Imaging of small-animal models of infectious diseases.Am J Pathol. 2013 Feb;182(2):296-304. doi: 10.1016/j.ajpath.2012.09.026. Epub 2012 Nov 28. Am J Pathol. 2013. PMID: 23201133 Free PMC article. Review.
-
The Rift Valley fever accessory proteins NSm and P78/NSm-GN are distinct determinants of virus propagation in vertebrate and invertebrate hosts.Emerg Microbes Infect. 2014 Oct;3(10):e71. doi: 10.1038/emi.2014.71. Epub 2014 Oct 1. Emerg Microbes Infect. 2014. PMID: 26038497 Free PMC article.
References
-
- Moutailler S, Krida G, Schaffner F, Vazeille M, Failloux AB. Potential vectors of Rift Valley fever virus in the Mediterranean region. Vector Borne Zoonotic Dis. 2008;8:749–753. - PubMed
-
- Hoogstraal H, Meegan JM, Khalil GM, Adham FK. The Rift Valley fever epizootic in Egypt 1977–78. 2. Ecological and entomological studies. Trans R Soc Trop Med Hyg. 1979;73:624–629. - PubMed
-
- Traore-Lamizana M, Fontenille D, Diallo M, Ba Y, Zeller HG, et al. Arbovirus surveillance from 1990 to 1995 in the Barkedji area (Ferlo) of Senegal, a possible natural focus of Rift Valley fever virus. J Med Entomol. 2001;38:480–492. - PubMed
-
- Meegan JM. The Rift Valley fever epizootic in Egypt 1977–78. 1. Description of the epizzotic and virological studies. Trans R Soc Trop Med Hyg. 1979;73:618–623. - PubMed
-
- Saluzzo JF, Digoutte JP, Chartier C, Martinez D, Bada R. Focus of Rift Valley fever virus transmission in southern Mauritania. Lancet. 1987;1:504. - PubMed
Publication types
MeSH terms
Substances
LinkOut - more resources
Full Text Sources
Other Literature Sources

