

Feasibility of fiber Bragg grating and long-period fiber grating sensors under different environmental conditions
- PMID: 22163460
- PMCID: PMC3230987
- DOI: 10.3390/s101110105
Feasibility of fiber Bragg grating and long-period fiber grating sensors under different environmental conditions
Abstract
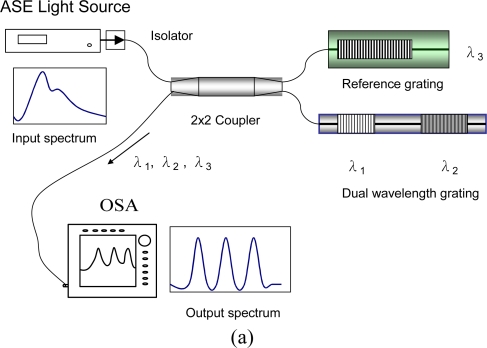
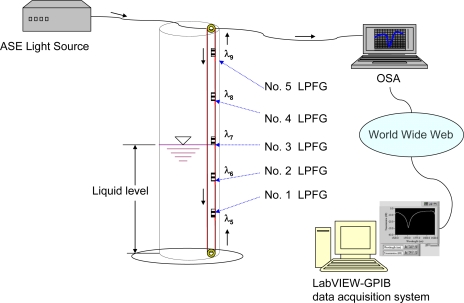
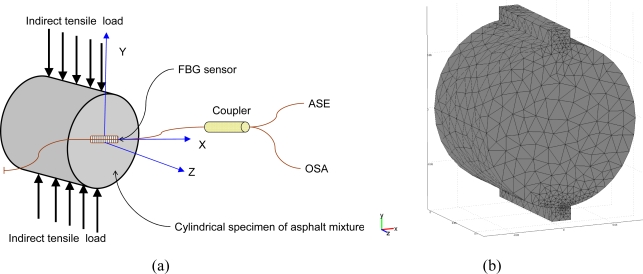
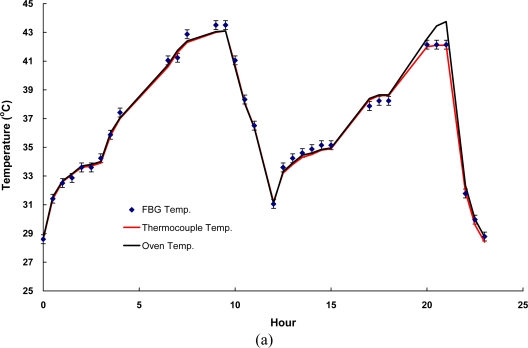
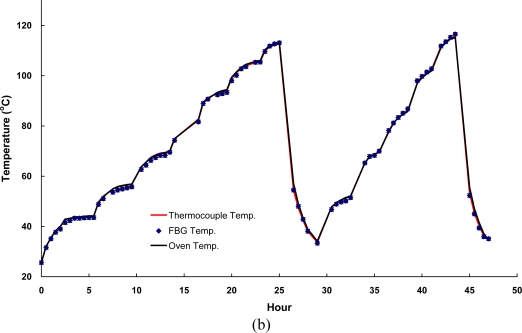
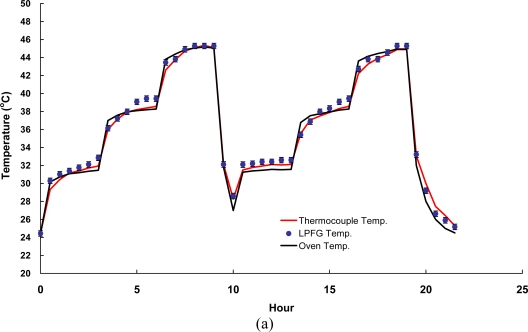
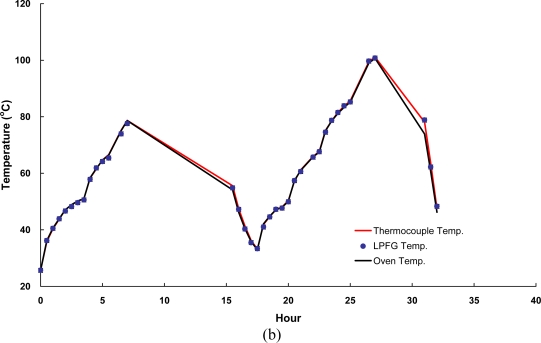
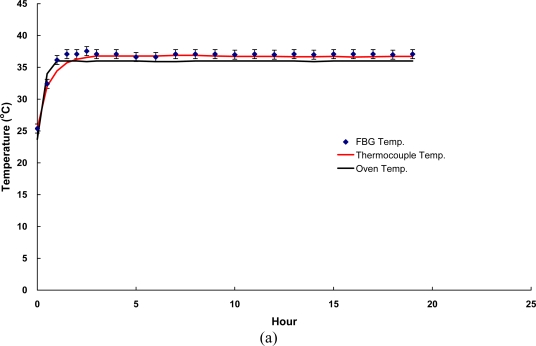
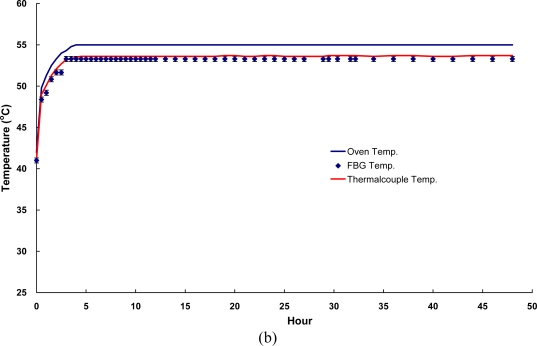
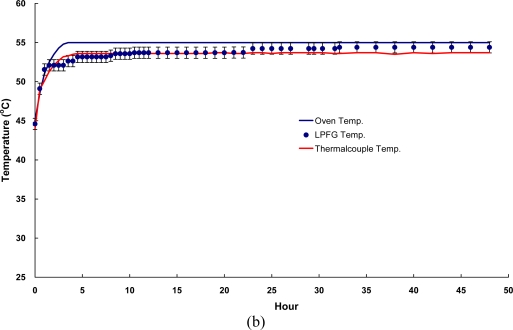
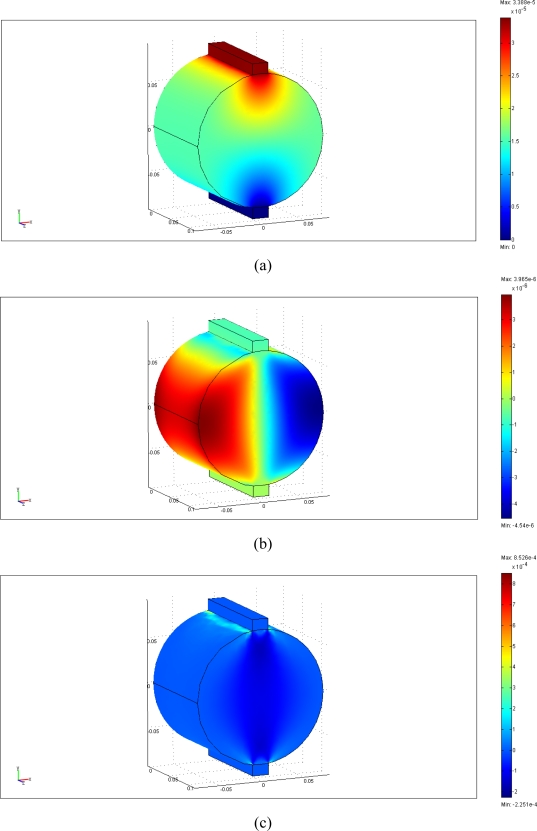
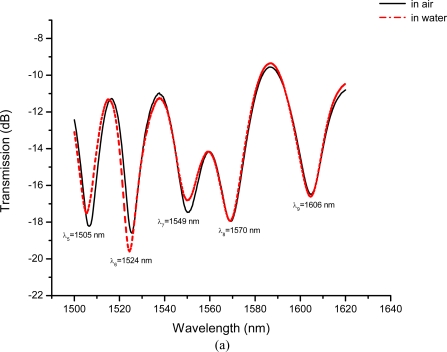
This paper presents the feasibility of utilizing fiber Bragg grating (FBG) and long-period fiber grating (LPFG) sensors for nondestructive evaluation (NDE) of infrastructures using Portland cement concretes and asphalt mixtures for temperature, strain, and liquid-level monitoring. The use of hybrid FBG and LPFG sensors is aimed at utilizing the advantages of two kinds of fiber grating to implement NDE for monitoring strains or displacements, temperatures, and water-levels of infrastructures such as bridges, pavements, or reservoirs for under different environmental conditions. Temperature fluctuation and stability tests were examined using FBG and LPFG sensors bonded on the surface of asphalt and concrete specimens. Random walk coefficient (RWC) and bias stability (BS) were used for the first time to indicate the stability performance of fiber grating sensors. The random walk coefficients of temperature variations between FBG (or LPFG) sensor and a thermocouple were found in the range of -0.7499 °C/ [square root]h to -1.3548 °C/ [square root]h. In addition, the bias stability for temperature variations, during the fluctuation and stability tests with FBG (or LPFG) sensors were within the range of 0.01 °C/h with a 15-18 h time cluster to 0.09 °C/h with a 3-4 h time cluster. This shows that the performance of FBG or LPFG sensors is comparable with that of conventional high-resolution thermocouple sensors under rugged conditions. The strain measurement for infrastructure materials was conducted using a packaged FBG sensor bonded on the surface of an asphalt specimen under indirect tensile loading conditions. A finite element modeling (FEM) was applied to compare experimental results of indirect tensile FBG strain measurements. For a comparative analysis between experiment and simulation, the FEM numerical results agreed with those from FBG strain measurements. The results of the liquid-level sensing tests show the LPFG-based sensor could discriminate five stationary liquid-levels and exhibits at least 1,050-mm liquid-level measurement capacity. Thus, the hybrid FBG and LPFG sensors reported here could benefit the NDE development and applications for infrastructure health monitoring such as strain, temperature and liquid-level measurements.
Keywords: 07.05.-t; 07.60.Vg; 42.81.-i.; fiber Bragg grating (FBG); finite element model; liquid-level; long-period fiber grating (LPFG); nondestructive evaluation (NDE); random walk coefficient; temperature, strain.
Figures


Similar articles
-
Optical sensor based on hybrid FBG/titanium dioxide coated LPFG for monitoring organic solvents in edible oils.Talanta. 2016;148:170-6. doi: 10.1016/j.talanta.2015.10.067. Epub 2015 Oct 26. Talanta. 2016. PMID: 26653438
-
[Spectral analysis of fiber bragg grating modulated by double long period grating and its application in smart structure monitoring].Guang Pu Xue Yu Guang Pu Fen Xi. 2009 Dec;29(12):3429-33. Guang Pu Xue Yu Guang Pu Fen Xi. 2009. PMID: 20210187 Chinese.
-
An optical fiber viscometer based on long-period fiber grating technology and capillary tube mechanism.Sensors (Basel). 2010;10(12):11174-88. doi: 10.3390/s101211174. Epub 2010 Dec 8. Sensors (Basel). 2010. PMID: 22163519 Free PMC article.
-
Fiber-Bragg-Grating-Based Displacement Sensors: Review of Recent Advances.Materials (Basel). 2022 Aug 12;15(16):5561. doi: 10.3390/ma15165561. Materials (Basel). 2022. PMID: 36013697 Free PMC article. Review.
-
Review of Chirped Fiber Bragg Grating (CFBG) Fiber-Optic Sensors and Their Applications.Sensors (Basel). 2018 Jul 4;18(7):2147. doi: 10.3390/s18072147. Sensors (Basel). 2018. PMID: 29973516 Free PMC article. Review.
Cited by
-
A polymer optical fiber fuel level sensor: application to paramotoring and powered paragliding.Sensors (Basel). 2012;12(5):6186-97. doi: 10.3390/s120506186. Epub 2012 May 10. Sensors (Basel). 2012. PMID: 22778637 Free PMC article.
-
Fabrication quality analysis of a fiber optic refractive index sensor created by CO2 laser machining.Sensors (Basel). 2013 Mar 26;13(4):4067-87. doi: 10.3390/s130404067. Sensors (Basel). 2013. PMID: 23535636 Free PMC article.
-
Application of CCG Sensors to a High-Temperature Structure Subjected to Thermo-Mechanical Load.Sensors (Basel). 2016 Oct 13;16(10):1686. doi: 10.3390/s16101686. Sensors (Basel). 2016. PMID: 27754356 Free PMC article.
-
A microfluidic long-period fiber grating sensor platform for chloride ion concentration measurement.Sensors (Basel). 2011;11(9):8550-68. doi: 10.3390/s110908550. Epub 2011 Sep 2. Sensors (Basel). 2011. PMID: 22164091 Free PMC article.
-
Functionality enhancement of industrialized optical fiber sensors and system developed for full-scale pavement monitoring.Sensors (Basel). 2014 May 19;14(5):8829-50. doi: 10.3390/s140508829. Sensors (Basel). 2014. PMID: 24854060 Free PMC article.
References
-
- Leng J, Asundi A. Structural health monitoring of smart composite materials by using the EFPI and FBG sensors. Sens. Actuat. A Phys. 2003;103:330–340.
-
- Leng J, Asundi A. Non-destructive evaluation of smart materials by using extrinsic Fabry—Perot interferometric and fiber Bragg grating sensors. NDT E. Int. 2002;35:273–276.
-
- Leng J, Asundi A. Real-time cure monitoring of smart composite materials using extrinsic Fabry-Perot interferometer and fiber Bragg grating sensors. Smart Mater. Struct. 2002;11:249–255.
-
- Udd E. Fiber Optic Smart Structures. Wiley; New York, NY, USA: 1995.
-
- Culshaw B, Dakin J. Optical Fiber Sensors: Applications, Analysis, and Future. Artech House; Boston, MA, USA: 1997.
Publication types
MeSH terms
LinkOut - more resources
Full Text Sources
