

"Smart" continuous glucose monitoring sensors: on-line signal processing issues
- PMID: 22163574
- PMCID: PMC3231130
- DOI: 10.3390/s100706751
"Smart" continuous glucose monitoring sensors: on-line signal processing issues
Abstract
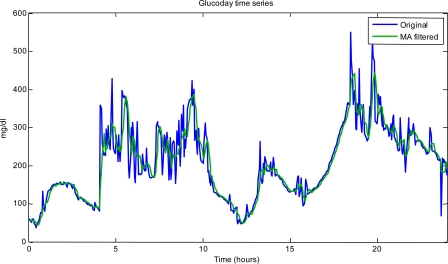
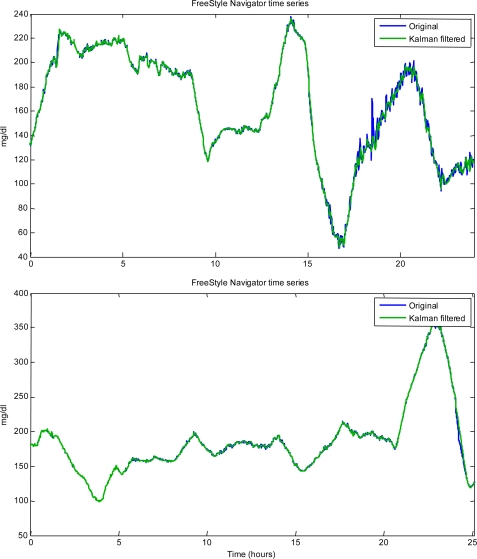
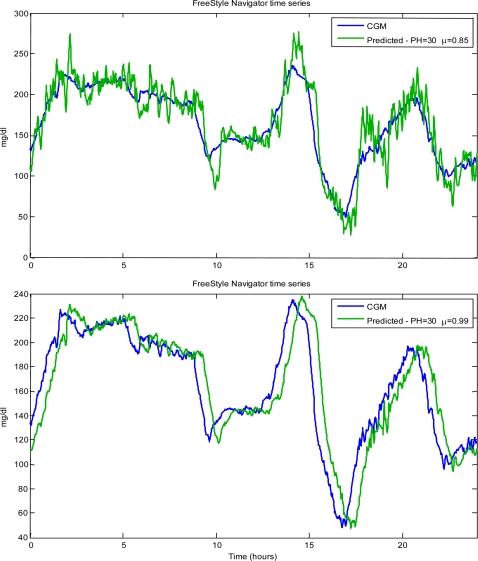
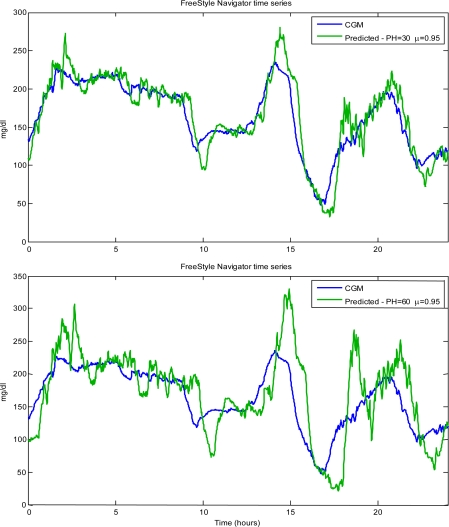
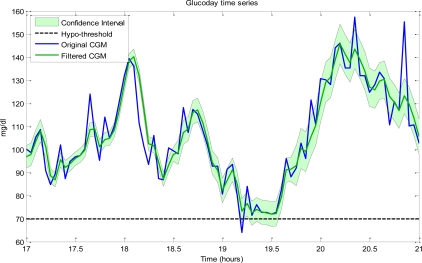
The availability of continuous glucose monitoring (CGM) sensors allows development of new strategies for the treatment of diabetes. In particular, from an on-line perspective, CGM sensors can become "smart" by providing them with algorithms able to generate alerts when glucose concentration is predicted to exceed the normal range thresholds. To do so, at least four important aspects have to be considered and dealt with on-line. First, the CGM data must be accurately calibrated. Then, CGM data need to be filtered in order to enhance their signal-to-noise ratio (SNR). Thirdly, predictions of future glucose concentration should be generated with suitable modeling methodologies. Finally, generation of alerts should be done by minimizing the risk of detecting false and missing true events. For these four challenges, several techniques, with various degrees of sophistication, have been proposed in the literature and are critically reviewed in this paper.
Keywords: calibration; diabetes; filtering; model; prediction; time-series.
Figures
Similar articles
-
Signal processing algorithms implementing the "smart sensor" concept to improve continuous glucose monitoring in diabetes.J Diabetes Sci Technol. 2013 Sep 1;7(5):1308-18. doi: 10.1177/193229681300700522. J Diabetes Sci Technol. 2013. PMID: 24124959 Free PMC article.
-
Continuous Glucose Monitoring Sensors: Past, Present and Future Algorithmic Challenges.Sensors (Basel). 2016 Dec 9;16(12):2093. doi: 10.3390/s16122093. Sensors (Basel). 2016. PMID: 27941663 Free PMC article. Review.
-
Calibration of Minimally Invasive Continuous Glucose Monitoring Sensors: State-of-The-Art and Current Perspectives.Biosensors (Basel). 2018 Mar 13;8(1):24. doi: 10.3390/bios8010024. Biosensors (Basel). 2018. PMID: 29534053 Free PMC article. Review.
-
Calibration algorithms for continuous glucose monitoring systems based on interstitial fluid sensing.Biosens Bioelectron. 2024 Sep 15;260:116450. doi: 10.1016/j.bios.2024.116450. Epub 2024 May 28. Biosens Bioelectron. 2024. PMID: 38843770 Review.
-
An online failure detection method of the glucose sensor-insulin pump system: improved overnight safety of type-1 diabetic subjects.IEEE Trans Biomed Eng. 2013 Feb;60(2):406-16. doi: 10.1109/TBME.2012.2227256. Epub 2012 Nov 15. IEEE Trans Biomed Eng. 2013. PMID: 23193300
Cited by
-
Non-invasive continuous glucose monitoring: improved accuracy of point and trend estimates of the Multisensor system.Med Biol Eng Comput. 2012 Oct;50(10):1047-57. doi: 10.1007/s11517-012-0932-6. Epub 2012 Jun 22. Med Biol Eng Comput. 2012. PMID: 22722898
-
Signal processing algorithms implementing the "smart sensor" concept to improve continuous glucose monitoring in diabetes.J Diabetes Sci Technol. 2013 Sep 1;7(5):1308-18. doi: 10.1177/193229681300700522. J Diabetes Sci Technol. 2013. PMID: 24124959 Free PMC article.
-
Comparison between one-point calibration and two-point calibration approaches in a continuous glucose monitoring algorithm.J Diabetes Sci Technol. 2014 Jul;8(4):709-19. doi: 10.1177/1932296814531356. Epub 2014 Apr 21. J Diabetes Sci Technol. 2014. PMID: 24876420 Free PMC article.
-
Current and Emerging Technology for Continuous Glucose Monitoring.Sensors (Basel). 2017 Jan 19;17(1):182. doi: 10.3390/s17010182. Sensors (Basel). 2017. PMID: 28106820 Free PMC article. Review.
-
Italian contributions to the development of continuous glucose monitoring sensors for diabetes management.Sensors (Basel). 2012 Oct 12;12(10):13753-80. doi: 10.3390/s121013753. Sensors (Basel). 2012. PMID: 23202020 Free PMC article. Review.
References
-
- Simon C, Brandenberger G, Follenius M. Ultradian oscillations of plasma glucose, insulin, and C-peptide in man during continuous enteral nutrition. J. Clin. Endocrinol Metab. 1987;64:669–674. - PubMed
-
- Hollingdal M, Juhl CB, Pincus SM, Sturis J, Veldhuis JD, Polonsky KS, Pørksen N, Schmitz O. Failure of physiological plasma glucose excursions to entrain high-frequency pulsatile insulin secretion in type 2 diabetes. Diabetes. 2000;49:1334–1340. - PubMed
-
- Magni P, Bellazzi R. A stochastic model to assess the variability of blood glucose time series in diabetic patients self-monitoring. IEEE Trans. Biomed. Eng. 2006;53:977–985. - PubMed
-
- Deutsch T, Lehmann ED, Carson ER, Roudsari AV, Hopkins KD, Sönksen PH. Time series analysis and control of blood glucose levels in diabetic patients. Comput. Methods Programs Biomed. 1994;41:167–182. - PubMed
Publication types
MeSH terms
LinkOut - more resources
Full Text Sources
Other Literature Sources
