

Exploiting the autofluorescent properties of photosynthetic pigments for analysis of pigmentation and morphology in live Fremyella diplosiphon cells
- PMID: 22163584
- PMCID: PMC3231140
- DOI: 10.3390/s100706969
Exploiting the autofluorescent properties of photosynthetic pigments for analysis of pigmentation and morphology in live Fremyella diplosiphon cells
Abstract
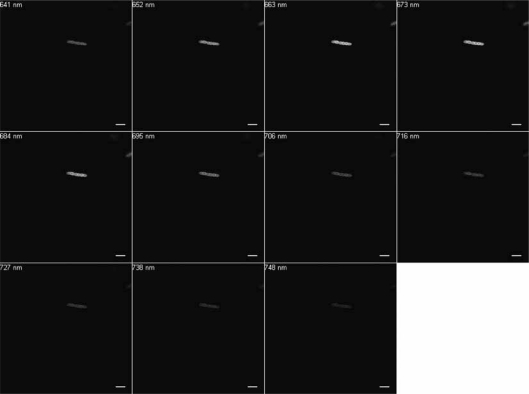
Fremyella diplosiphon is a freshwater, filamentous cyanobacterium that exhibits light-dependent regulation of photosynthetic pigment accumulation and cellular and filament morphologies in a well-known process known as complementary chromatic adaptation (CCA). One of the techniques used to investigate the molecular bases of distinct aspects of CCA is confocal laser scanning microscopy (CLSM). CLSM capitalizes on the autofluorescent properties of cyanobacterial phycobiliproteins and chlorophyll a. We employed CLSM to perform spectral scanning analyses of F. diplosiphon strains grown under distinct light conditions. We report optimized utilization of CLSM to elucidate the molecular basis of the photoregulation of pigment accumulation and morphological responses in F. diplosiphon.
Keywords: autofluorescence; confocal laser scanning microscopy; cyanobacteria; fluorescence imaging; light; microscopy; morphology; phycobiliproteins.
Figures


Similar articles
-
Convergence and divergence of the photoregulation of pigmentation and cellular morphology in Fremyella diplosiphon.Plant Signal Behav. 2011 Dec;6(12):2038-41. doi: 10.4161/psb.6.12.18239. Plant Signal Behav. 2011. PMID: 22112451 Free PMC article.
-
Independence and interdependence of the photoregulation of pigmentation and development in Fremyella diplosiphon.Commun Integr Biol. 2010 Mar;3(2):151-3. doi: 10.4161/cib.3.2.10367. Commun Integr Biol. 2010. PMID: 20585508 Free PMC article.
-
Salinity impacts photosynthetic pigmentation and cellular morphology changes by distinct mechanisms in Fremyella diplosiphon.Biochem Biophys Res Commun. 2013 Mar 29;433(1):84-9. doi: 10.1016/j.bbrc.2013.02.060. Epub 2013 Feb 27. Biochem Biophys Res Commun. 2013. PMID: 23454384
-
Live-cell imaging of cyanobacteria.Photosynth Res. 2015 Oct;126(1):33-46. doi: 10.1007/s11120-014-0049-x. Epub 2014 Nov 4. Photosynth Res. 2015. PMID: 25366827 Review.
-
Chlorophyll fluorescence analysis of cyanobacterial photosynthesis and acclimation.Microbiol Mol Biol Rev. 1998 Sep;62(3):667-83. doi: 10.1128/MMBR.62.3.667-683.1998. Microbiol Mol Biol Rev. 1998. PMID: 9729605 Free PMC article. Review.
Cited by
-
Biosignatures Associated with Freshwater Microbialites.Life (Basel). 2020 May 15;10(5):66. doi: 10.3390/life10050066. Life (Basel). 2020. PMID: 32429118 Free PMC article.
-
The Tryptophan-Rich Sensory Protein (TSPO) is Involved in Stress-Related and Light-Dependent Processes in the Cyanobacterium Fremyella diplosiphon.Front Microbiol. 2015 Dec 14;6:1393. doi: 10.3389/fmicb.2015.01393. eCollection 2015. Front Microbiol. 2015. PMID: 26696996 Free PMC article.
-
Temporal dynamics of changes in reactive oxygen species (ROS) levels and cellular morphology are coordinated during complementary chromatic acclimation in Fremyella diplosiphon.Photosynth Res. 2013 Oct 14. doi: 10.1007/s11120-013-9938-7. Online ahead of print. Photosynth Res. 2013. PMID: 24122367
-
Complementary Assessment of Commercial Photoluminescent Pigments Printed on Cotton Fabric.Polymers (Basel). 2019 Jul 20;11(7):1216. doi: 10.3390/polym11071216. Polymers (Basel). 2019. PMID: 31330778 Free PMC article.
-
Regulation of BolA abundance mediates morphogenesis in Fremyella diplosiphon.Front Microbiol. 2015 Nov 5;6:1215. doi: 10.3389/fmicb.2015.01215. eCollection 2015. Front Microbiol. 2015. PMID: 26594203 Free PMC article.
References
-
- Kehoe DM, Grossman AR. Similarity of a chromatic adaptation sensor to phytochrome and ethylene receptors. Science. 1996;273:1409–1412. - PubMed
-
- Terauchi K, Montgomery BL, Grossman AR, Lagarias JC, Kehoe DM. RcaE is a complementary chromatic adaptation photoreceptor required for green and red light responsiveness. Mol. Microbiol. 2004;51:567–577. - PubMed
-
- Grossman AR. A molecular understanding of complementary chromatic adaptation. Photosynth. Res. 2003;76:207–215. - PubMed
Publication types
MeSH terms
Substances
LinkOut - more resources
Full Text Sources
