

Fluorescent chemosensors for toxic organophosphorus pesticides: a review
- PMID: 22163587
- PMCID: PMC3231149
- DOI: 10.3390/s100707018
Fluorescent chemosensors for toxic organophosphorus pesticides: a review
Abstract
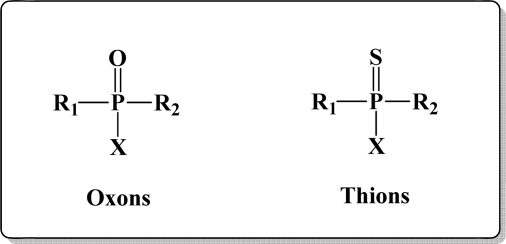
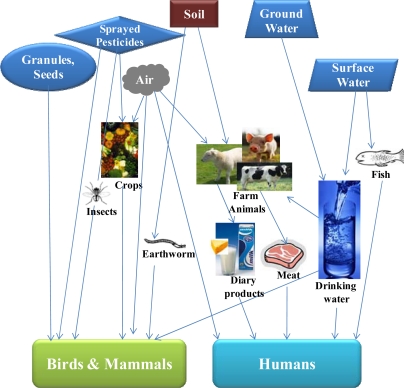
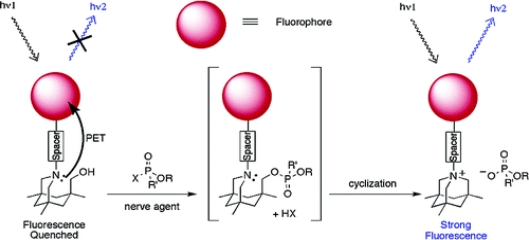
Many organophosphorus (OP) based compounds are highly toxic and powerful inhibitors of cholinesterases that generate serious environmental and human health concerns. Organothiophosphates with a thiophosphoryl (P=S) functional group constitute a broad class of these widely used pesticides. They are related to the more reactive phosphoryl (P=O) organophosphates, which include very lethal nerve agents and chemical warfare agents, such as, VX, Soman and Sarin. Unfortunately, widespread and frequent commercial use of OP-based compounds in agricultural lands has resulted in their presence as residues in crops, livestock, and poultry products and also led to their migration into aquifers. Thus, the design of new sensors with improved analyte selectivity and sensitivity is of paramount importance in this area. Herein, we review recent advances in the development of fluorescent chemosensors for toxic OP pesticides and related compounds. We also discuss challenges and progress towards the design of future chemosensors with dual modes for signal transduction.
Keywords: dual modes of signal transduction; fluorescent chemosensors; organophosphorus compounds; pollutants.
Figures


Similar articles
-
Organic-Molecule-Based Fluorescent Chemosensor for Nerve Agents and Organophosphorus Pesticides.Top Curr Chem (Cham). 2021 Aug 4;379(5):33. doi: 10.1007/s41061-021-00345-7. Top Curr Chem (Cham). 2021. PMID: 34346011 Review.
-
Advances in detection of hazardous organophosphorus compounds using organophosphorus hydrolase based biosensors.Crit Rev Toxicol. 2019 May;49(5):387-410. doi: 10.1080/10408444.2019.1626800. Epub 2019 Jul 3. Crit Rev Toxicol. 2019. PMID: 31268806 Review.
-
Acute toxicity of some nerve agents and pesticides in rats.Drug Chem Toxicol. 2015 Jan;38(1):32-6. doi: 10.3109/01480545.2014.900070. Epub 2014 Mar 18. Drug Chem Toxicol. 2015. PMID: 24641243
-
Bio-sensing of organophosphorus pesticides: A review.Biosens Bioelectron. 2019 Sep 1;140:111348. doi: 10.1016/j.bios.2019.111348. Epub 2019 May 24. Biosens Bioelectron. 2019. PMID: 31153016 Review.
-
Assessing protection against OP pesticides and nerve agents provided by wild-type HuPON1 purified from Trichoplusia ni larvae or induced via adenoviral infection.Chem Biol Interact. 2013 Mar 25;203(1):177-80. doi: 10.1016/j.cbi.2012.10.015. Epub 2012 Nov 2. Chem Biol Interact. 2013. PMID: 23123254
Cited by
-
Mutagenicity and genotoxicity of dicapthon insecticide.Cytotechnology. 2014 Oct;66(5):741-51. doi: 10.1007/s10616-013-9623-x. Epub 2014 Jan 31. Cytotechnology. 2014. PMID: 24477548 Free PMC article.
-
Optoelectronic nose based on an origami paper sensor for selective detection of pesticide aerosols.Sci Rep. 2020 Oct 14;10(1):17302. doi: 10.1038/s41598-020-74509-8. Sci Rep. 2020. PMID: 33057151 Free PMC article.
-
Easy-to-use and reliable absorbance-based MPH-GST biosensor for the detection of methyl parathion pesticide.Biotechnol Rep (Amst). 2020 Jun 23;27:e00495. doi: 10.1016/j.btre.2020.e00495. eCollection 2020 Sep. Biotechnol Rep (Amst). 2020. PMID: 32642456 Free PMC article.
-
Diverse applications of electronic-nose technologies in agriculture and forestry.Sensors (Basel). 2013 Feb 8;13(2):2295-348. doi: 10.3390/s130202295. Sensors (Basel). 2013. PMID: 23396191 Free PMC article. Review.
-
Colorimetric and Fluorometric N-Acylhydrazone-based Chemosensors for Detection of Single to Multiple Metal Ions: Design Strategies and Analytical Applications.J Fluoresc. 2025 May;35(5):2569-2621. doi: 10.1007/s10895-024-03748-z. Epub 2024 Jun 10. J Fluoresc. 2025. PMID: 38856800 Review.
References
-
- Ariese F, Ernst WHO, Sijm DTHM. Natural and synthetic organic compounds in the environment—A symposium report. Environ. Toxicol. Pharmacol. 2001;10:65–80. - PubMed
-
- Karr JR, Dudley DR. Ecological perspective on water quality goals. Environ. Manage. 1981;5:55–68.
-
- U.S. EPA. Pesticides and food: Why children may be especially sensitive to pesticides. Available online: http://www.epa.gov/pesticides/food/pest.htm (accessed on February 26, 2010).
-
- Survey, U.S.G. Organophosphorus pesticides occurrence and distribution in surface and ground water of the United States. Available online: http://ga.water.usgs.gov/publications/ofr00-187.pdf. (accessed on 26 February 2010).
-
- The Pesticide Action Network (PAN) Pesticide Action Network (PAN) pesticide database. Available online: http://www.pesticideinfo.org. (accessed on 26 February 2010).
Publication types
MeSH terms
Substances
LinkOut - more resources
Full Text Sources
Other Literature Sources
Medical
Miscellaneous
