

A new laboratory radio frequency identification (RFID) system for behavioural tracking of marine organisms
- PMID: 22163710
- PMCID: PMC3231282
- DOI: 10.3390/s111009532
A new laboratory radio frequency identification (RFID) system for behavioural tracking of marine organisms
Abstract
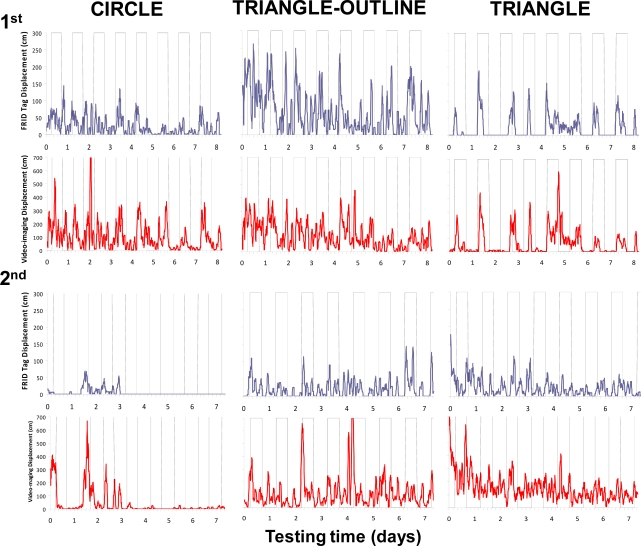
Radio frequency identification (RFID) devices are currently used to quantify several traits of animal behaviour with potential applications for the study of marine organisms. To date, behavioural studies with marine organisms are rare because of the technical difficulty of propagating radio waves within the saltwater medium. We present a novel RFID tracking system to study the burrowing behaviour of a valuable fishery resource, the Norway lobster (Nephrops norvegicus L.). The system consists of a network of six controllers, each handling a group of seven antennas. That network was placed below a microcosm tank that recreated important features typical of Nephrops' grounds, such as the presence of multiple burrows. The animals carried a passive transponder attached to their telson, operating at 13.56 MHz. The tracking system was implemented to concurrently report the behaviour of up to three individuals, in terms of their travelled distances in a specified unit of time and their preferential positioning within the antenna network. To do so, the controllers worked in parallel to send the antenna data to a computer via a USB connection. The tracking accuracy of the system was evaluated by concurrently recording the animals' behaviour with automated video imaging. During the two experiments, each lasting approximately one week, two different groups of three animals each showed a variable burrow occupancy and a nocturnal displacement under a standard photoperiod regime (12 h light:12 h dark), measured using the RFID method. Similar results were obtained with the video imaging. Our implemented RFID system was therefore capable of efficiently tracking the tested organisms and has a good potential for use on a wide variety of other marine organisms of commercial, aquaculture, and ecological interest.
Keywords: Nephrops norvegicus; RFID; USB communication; activity rhythms; automated video imaging; burrow emergence; controller; laboratory; marine species.
Figures


Similar articles
-
A new tracking system for the measurement of diel locomotor rhythms in the Norway lobster, Nephrops norvegicus (L.).J Neurosci Methods. 2008 Aug 30;173(2):215-24. doi: 10.1016/j.jneumeth.2008.06.009. Epub 2008 Jun 20. J Neurosci Methods. 2008. PMID: 18606187
-
A new morphometric implemented video-image analysis protocol for the study of social modulation in activity rhythms of marine organisms.J Neurosci Methods. 2009 Oct 30;184(1):161-8. doi: 10.1016/j.jneumeth.2009.07.013. Epub 2009 Jul 18. J Neurosci Methods. 2009. PMID: 19619586
-
Light intensity determines temporal niche switching of behavioral activity in deep-water Nephrops norvegicus (Crustacea: Decapoda).J Biol Rhythms. 2010 Aug;25(4):277-87. doi: 10.1177/0748730410376159. J Biol Rhythms. 2010. PMID: 20679497
-
RFID-supported video tracking for automated analysis of social behaviour in groups of mice.J Neurosci Methods. 2019 Sep 1;325:108323. doi: 10.1016/j.jneumeth.2019.108323. Epub 2019 Jun 27. J Neurosci Methods. 2019. PMID: 31255597 Review.
-
Setting the stage to tag "n" track: a guideline for implementing, validating and reporting a radio frequency identification system for monitoring resource visit behavior in poultry.Poult Sci. 2023 Aug;102(8):102799. doi: 10.1016/j.psj.2023.102799. Epub 2023 May 22. Poult Sci. 2023. PMID: 37315427 Free PMC article. Review.
Cited by
-
LocoMote: AI-driven Sensor Tags for Fine-Grained Undersea Localization and Sensing.IEEE Sens J. 2024 May 15;24(10):16999-17018. doi: 10.1109/jsen.2024.3383721. Epub 2024 Apr 5. IEEE Sens J. 2024. PMID: 39640899 Free PMC article.
-
How to quantify animal activity from radio-frequency identification (RFID) recordings.Ecol Evol. 2018 Oct 2;8(20):10166-10174. doi: 10.1002/ece3.4491. eCollection 2018 Oct. Ecol Evol. 2018. PMID: 30397456 Free PMC article.
-
Cost-Effective Implementation of a Temperature Traceability System Based on Smart RFID Tags and IoT Services.Sensors (Basel). 2020 Feb 20;20(4):1163. doi: 10.3390/s20041163. Sensors (Basel). 2020. PMID: 32093218 Free PMC article.
References
-
- Roberts CM. Radio frequency identification (RFID) Comput. Secur. 2006;25:18–26.
-
- Beulens JMA, Douwe-Frits B, Folstar P, Hofstede GJ. Food safety and transparency in food chains and networks—Relationships and challenges. Food Control. 2005;16:481–486.
-
- Halachmi I. Remote animal identification and location. Proceedings of the Annual International Meeting of the American Society of Agricultural Engineers; Milwaukee, WI, USA. 9–12 July 2000; pp. 1–5.
-
- Barbari M. The use of global positioning and geographical information systems in the management of extensive cattle grazing. Biosyst. Eng. 2006;95:271–280.
-
- Streit S, Bock F, Pirk CWW, Tautz J. Automatic lifelong monitoring of individual insect behaviour now possible. Zoology (Jena) 2003;106:169–171. - PubMed
Publication types
MeSH terms
LinkOut - more resources
Full Text Sources
