

Automated data quality assessment of marine sensors
- PMID: 22163714
- PMCID: PMC3231286
- DOI: 10.3390/s111009589
Automated data quality assessment of marine sensors
Abstract
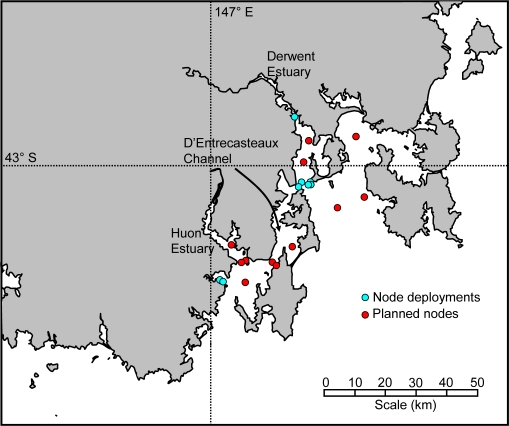
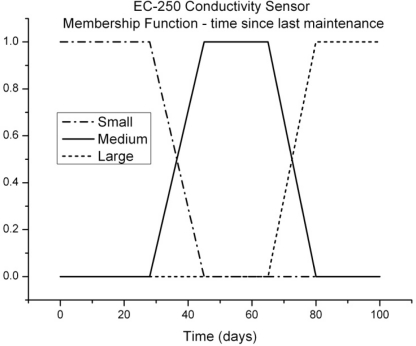
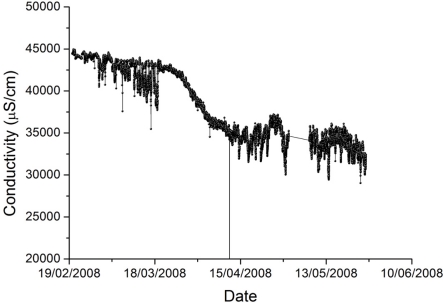
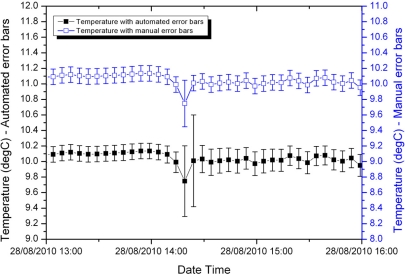
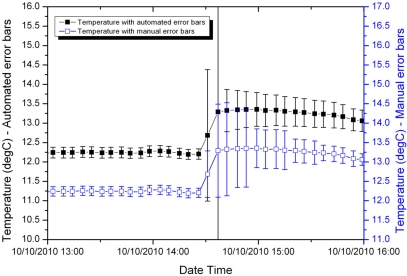
The automated collection of data (e.g., through sensor networks) has led to a massive increase in the quantity of environmental and other data available. The sheer quantity of data and growing need for real-time ingestion of sensor data (e.g., alerts and forecasts from physical models) means that automated Quality Assurance/Quality Control (QA/QC) is necessary to ensure that the data collected is fit for purpose. Current automated QA/QC approaches provide assessments based upon hard classifications of the gathered data; often as a binary decision of good or bad data that fails to quantify our confidence in the data for use in different applications. We propose a novel framework for automated data quality assessments that uses Fuzzy Logic to provide a continuous scale of data quality. This continuous quality scale is then used to compute error bars upon the data, which quantify the data uncertainty and provide a more meaningful measure of the data's fitness for purpose in a particular application compared with hard quality classifications. The design principles of the framework are presented and enable both data statistics and expert knowledge to be incorporated into the uncertainty assessment. We have implemented and tested the framework upon a real time platform of temperature and conductivity sensors that have been deployed to monitor the Derwent Estuary in Hobart, Australia. Results indicate that the error bars generated from the Fuzzy QA/QC implementation are in good agreement with the error bars manually encoded by a domain expert.
Keywords: fuzzy logic; measurement results; quality; sensors.
Figures
References
-
- Kleppner D, Sharp PA. Research data in the digital age. Science. 2009;325:368. - PubMed
-
- Committee on Science, Engineering, and Public Policy . Ensuring the Integrity, Accessibility, and Stewardship of Research Data in the Digital Age. National Academy of Sciences; Washington, DC, USA: 2009. Report of the Committee on Ensuring the Utility and Integrity of Research Data in a Digital Age. - PubMed
-
- Potter RW. The Art of Measurement: Theory and Practice. Prentice Hall; Upper Saddle River, NJ, USA; 2000.
-
- International Organization for Standardization . Guide to the Expression of Uncertainty in Measurement. ISO; Geneva, Switzerland: 1995.
-
- National Conference of Standards Laboratories . US Guide to the Expression of Uncertainty in Measurement. American National Standards Institute/NCSL International; Boulder, CO, USA: ANSI/NCSL Z540-2-1997.
MeSH terms
LinkOut - more resources
Full Text Sources
Research Materials
